# Technical Document Extraction: Line Graph Analysis
## Axis Labels and Markers
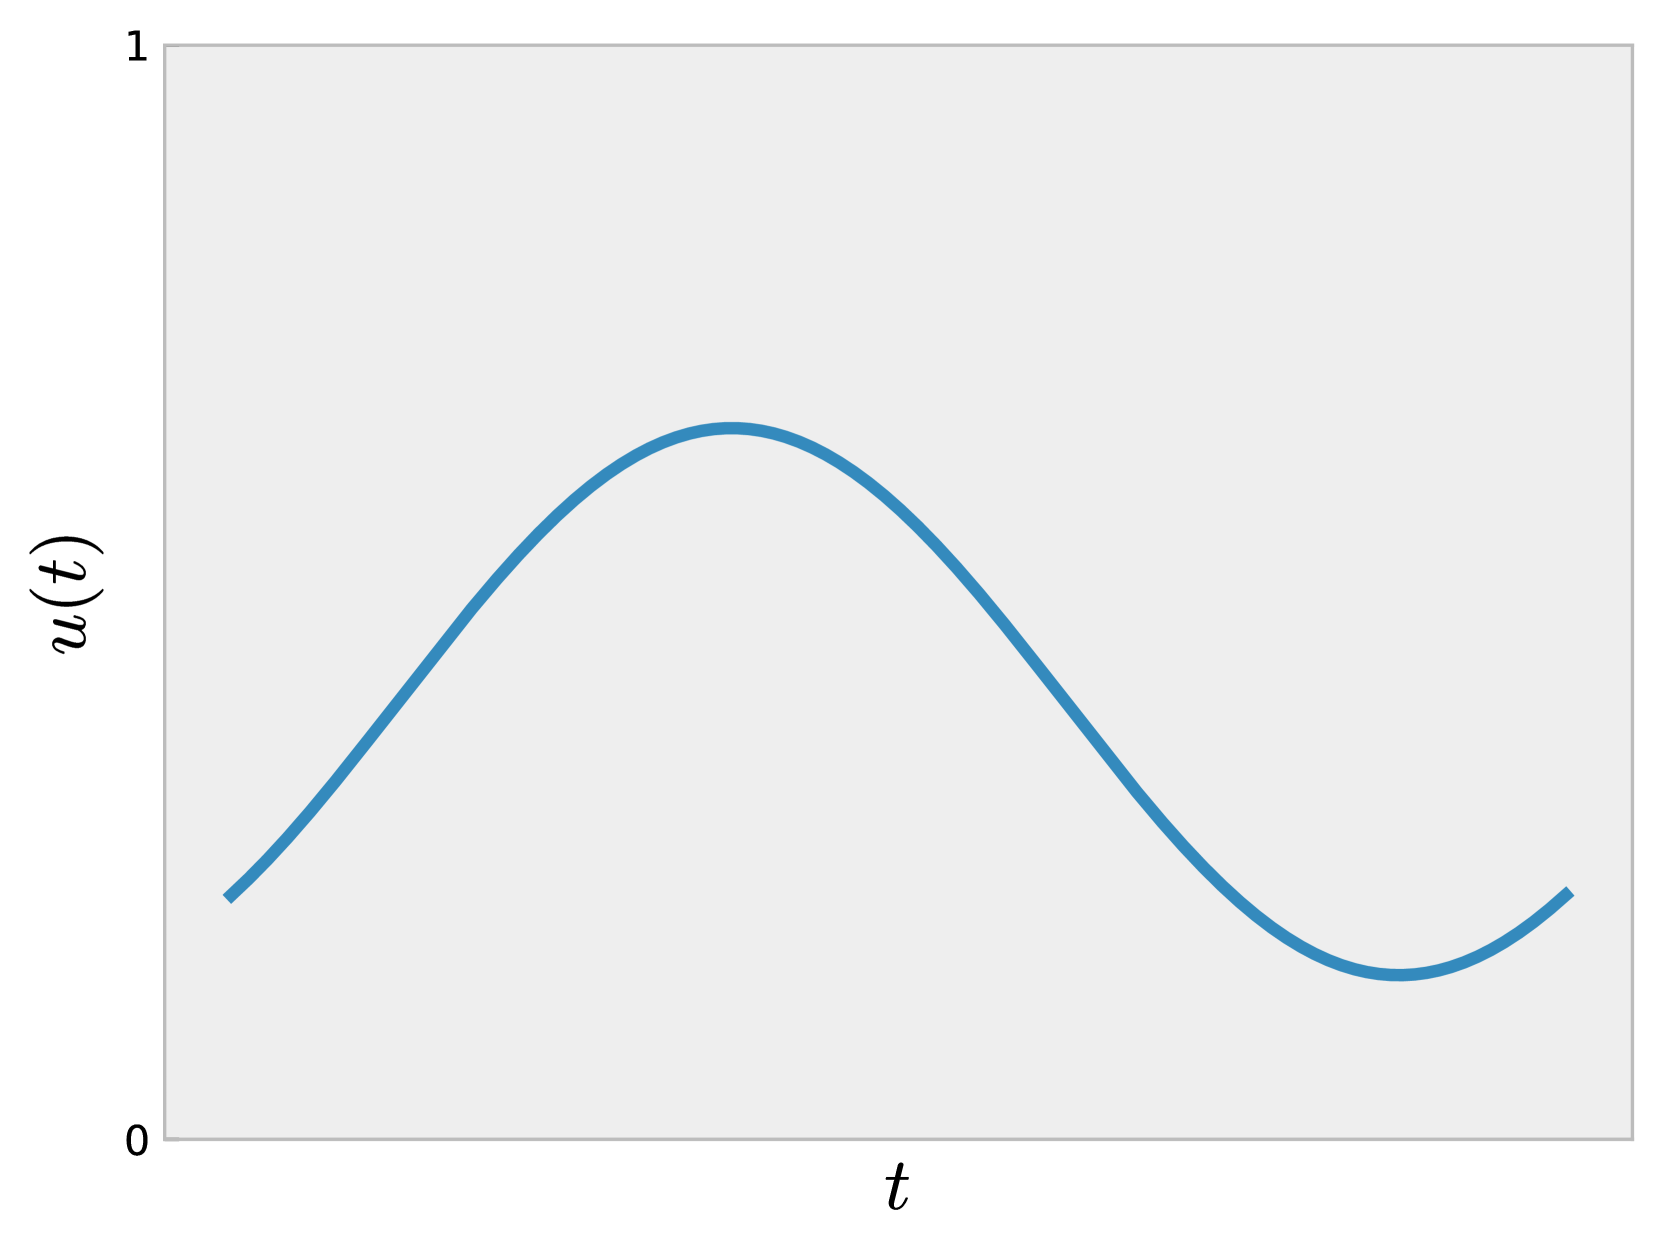
- **Y-Axis**: Labeled as $ u(t) $, with numerical range from **0** to **1**.
- **X-Axis**: Labeled as $ t $, with no explicit numerical markers or gridlines visible.
- **Units**: No explicit units provided for $ u(t) $ or $ t $.
## Line Characteristics
- **Color**: Solid blue line.
- **Behavior**:
1. **Initial Rise**: Starts at the lower-left corner (near $ u(t) = 0 $) and ascends smoothly.
2. **Peak**: Reaches a local maximum (highest point on the curve).
3. **Decline**: Descends to a trough (lowest point after the peak).
4. **Final Rise**: Slightly ascends again toward the right edge of the graph.
## Observations
- **No Gridlines**: The graph lacks gridlines, making precise value extraction difficult.
- **No Legend**: No legend is present to associate the line with specific data categories or variables.
- **No Data Points**: No discrete data points or markers are labeled along the curve.
- **Asymptotic Behavior**: The line does not reach $ u(t) = 1 $ or $ u(t) = 0 $ at any point, suggesting bounded oscillations.
## Key Trends
1. **Monotonic Increase**: The first segment of the curve is strictly increasing.
2. **Single Peak**: A single global maximum is observed.
3. **Bimodal Decline**: The curve exhibits a concave-down decline followed by a concave-up rise, forming a "valley" (trough).
4. **Final Asymptote**: The line approaches a higher value than its starting point but does not complete a full oscillation cycle.
## Missing Elements
- **No Title**: The graph lacks a descriptive title.
- **No Annotations**: No annotations or explanatory notes are present.
- **No Scale**: The x-axis ($ t $) lacks a defined scale or time units.
## Conclusion
The graph represents a time-dependent function $ u(t) $ with a single peak and trough, bounded between 0 and 1. The absence of gridlines, legends, and data points limits quantitative analysis but highlights qualitative trends in the function's behavior.