## Line Chart: Accuracy vs. Number of Operations
### Overview
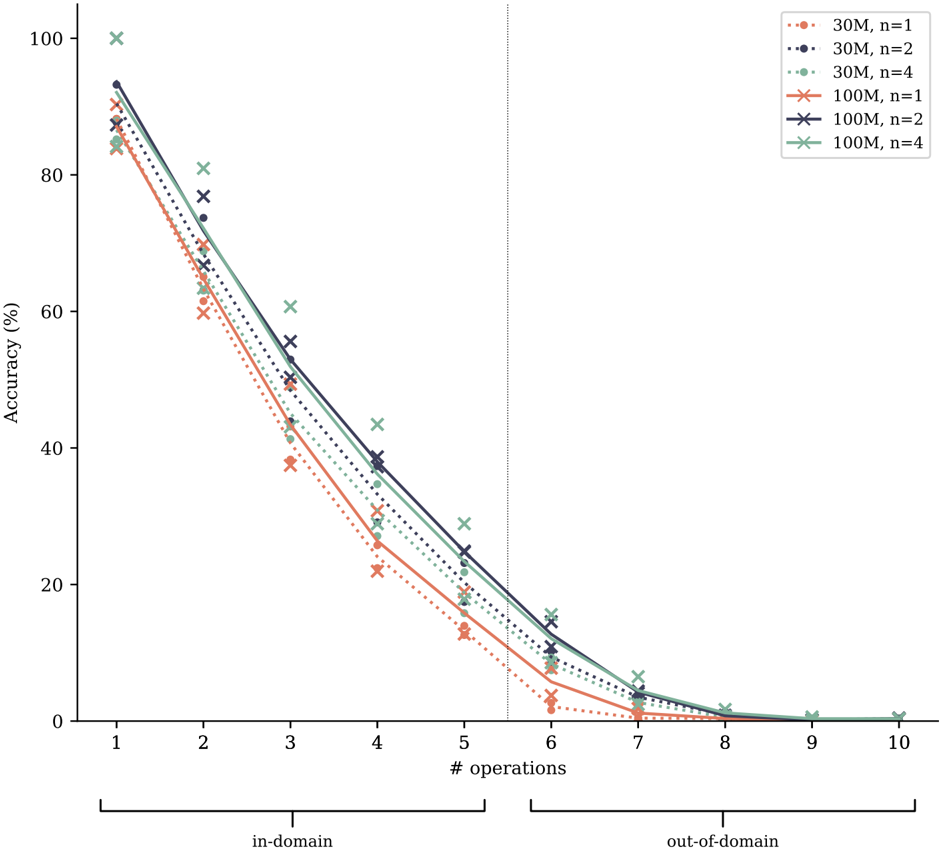
The image is a line chart that plots the accuracy (in percentage) against the number of operations. The chart compares the performance of two models (30M and 100M) with different configurations (n=1, n=2, and n=4) across a range of operations, distinguishing between "in-domain" and "out-of-domain" operations.
### Components/Axes
* **X-axis:** "# operations" ranging from 1 to 10. The x-axis is divided into two regions: "in-domain" (operations 1-5) and "out-of-domain" (operations 6-10).
* **Y-axis:** "Accuracy (%)" ranging from 0 to 100.
* **Legend:** Located in the top-right corner, the legend identifies the different lines based on model size (30M, 100M) and configuration (n=1, n=2, n=4).
* 30M, n=1: Dotted red-orange line
* 30M, n=2: Dotted dark blue line
* 30M, n=4: Dotted teal line
* 100M, n=1: Solid red-orange line with "x" markers
* 100M, n=2: Solid dark blue line with "x" markers
* 100M, n=4: Solid teal line with "x" markers
* A vertical dotted line separates the "in-domain" and "out-of-domain" regions at x=5.5.
### Detailed Analysis
* **30M, n=1 (Dotted red-orange line):**
* Trend: Accuracy decreases rapidly.
* Values: Approximately 85% at operation 1, 60% at operation 2, 38% at operation 3, 25% at operation 4, 15% at operation 5, 5% at operation 6, and near 0% from operation 7 onwards.
* **30M, n=2 (Dotted dark blue line):**
* Trend: Accuracy decreases rapidly.
* Values: Approximately 90% at operation 1, 65% at operation 2, 45% at operation 3, 30% at operation 4, 20% at operation 5, 10% at operation 6, and near 0% from operation 7 onwards.
* **30M, n=4 (Dotted teal line):**
* Trend: Accuracy decreases rapidly.
* Values: Approximately 88% at operation 1, 68% at operation 2, 48% at operation 3, 33% at operation 4, 22% at operation 5, 12% at operation 6, and near 0% from operation 7 onwards.
* **100M, n=1 (Solid red-orange line with "x" markers):**
* Trend: Accuracy decreases rapidly.
* Values: Approximately 87% at operation 1, 62% at operation 2, 40% at operation 3, 27% at operation 4, 17% at operation 5, 7% at operation 6, and near 0% from operation 7 onwards.
* **100M, n=2 (Solid dark blue line with "x" markers):**
* Trend: Accuracy decreases rapidly.
* Values: Approximately 92% at operation 1, 70% at operation 2, 50% at operation 3, 35% at operation 4, 23% at operation 5, 13% at operation 6, and near 0% from operation 7 onwards.
* **100M, n=4 (Solid teal line with "x" markers):**
* Trend: Accuracy decreases rapidly.
* Values: Approximately 100% at operation 1, 78% at operation 2, 58% at operation 3, 40% at operation 4, 25% at operation 5, 15% at operation 6, and near 0% from operation 7 onwards.
### Key Observations
* All models and configurations exhibit a rapid decline in accuracy as the number of operations increases.
* The 100M models generally outperform the 30M models across all configurations.
* Increasing the 'n' value (likely representing the number of parallel processing units or similar) generally improves accuracy for both 30M and 100M models.
* The transition from "in-domain" to "out-of-domain" operations (after operation 5) does not appear to cause a significant change in the rate of accuracy decline. The decline is consistent across both domains.
* The 100M, n=4 configuration starts with the highest accuracy (100% at operation 1) and maintains a higher accuracy throughout the initial operations.
### Interpretation
The data suggests that the accuracy of the models is highly sensitive to the number of operations performed. The larger model (100M) and higher configuration (n=4) consistently achieve better accuracy, indicating that model size and configuration play a crucial role in performance. The rapid decline in accuracy with increasing operations suggests that the models may struggle with longer or more complex sequences of operations. The "out-of-domain" operations do not appear to have a disproportionate impact on accuracy compared to "in-domain" operations, suggesting that the models' performance degradation is primarily driven by the number of operations rather than the specific nature of those operations. The 100M n=4 model is the best performing model.