## Line Chart: Accuracy vs. Number of Operations for Different Model Configurations
### Overview
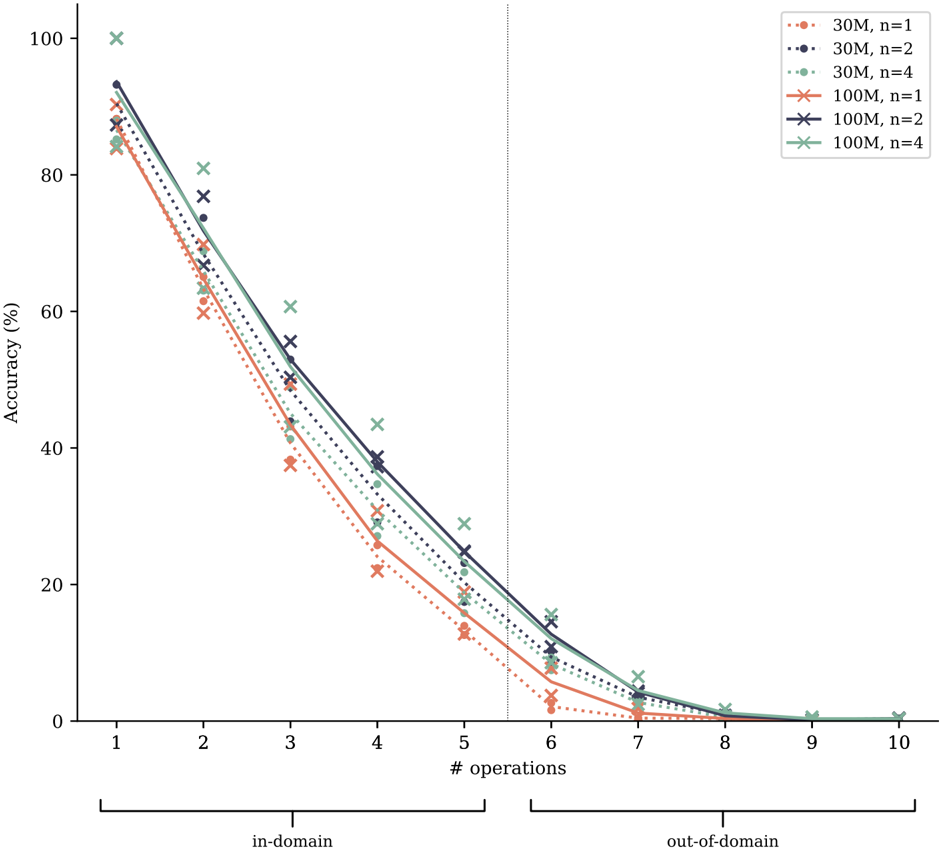
The image is a line chart plotting model accuracy (as a percentage) against the number of operations performed. It compares six different model configurations, defined by two model sizes (30M and 100M parameters) and three values of a parameter 'n' (1, 2, 4). The chart is divided into two distinct regions, "in-domain" and "out-of-domain," separated by a vertical dashed line. All data series show a strong, consistent downward trend in accuracy as the number of operations increases.
### Components/Axes
* **X-Axis:** Labeled "# operations". It is a linear scale with major tick marks at integers from 1 to 10.
* **Y-Axis:** Labeled "Accuracy (%)". It is a linear scale with major tick marks at 0, 20, 40, 60, 80, and 100.
* **Legend:** Positioned in the top-right corner of the chart area. It contains six entries, each specifying a model size, an 'n' value, and a corresponding line style and marker.
* **Domain Separator:** A vertical dashed gray line is positioned at approximately x = 5.5. Below the x-axis, a bracket labeled "in-domain" spans from x=1 to x=5.5, and a bracket labeled "out-of-domain" spans from x=5.5 to x=10.
### Detailed Analysis
**Legend Entries & Visual Encoding:**
1. `30M, n=1`: Dotted orange line with circular markers (●).
2. `30M, n=2`: Dotted dark blue/purple line with circular markers (●).
3. `30M, n=4`: Dotted green line with circular markers (●).
4. `100M, n=1`: Solid orange line with 'x' markers (×).
5. `100M, n=2`: Solid dark blue/purple line with 'x' markers (×).
6. `100M, n=4`: Solid green line with 'x' markers (×).
**Data Series Trends and Approximate Values:**
*General Trend:* All six lines slope steeply downward from left to right. Accuracy is highest at 1 operation and approaches 0% by 7-10 operations.
* **30M Models (Dotted Lines):**
* `30M, n=1` (Orange Dotted): Starts at ~85% (op=1). Drops to ~60% (op=2), ~40% (op=3), ~22% (op=4), ~12% (op=5). In the out-of-domain region, it falls to ~2% (op=6) and near 0% thereafter.
* `30M, n=2` (Blue Dotted): Starts at ~88% (op=1). Drops to ~75% (op=2), ~50% (op=3), ~35% (op=4), ~20% (op=5). In out-of-domain, ~8% (op=6), ~3% (op=7), then near 0%.
* `30M, n=4` (Green Dotted): Starts at ~84% (op=1). Drops to ~65% (op=2), ~45% (op=3), ~30% (op=4), ~18% (op=5). In out-of-domain, ~7% (op=6), ~2% (op=7), then near 0%.
* **100M Models (Solid Lines):**
* `100M, n=1` (Orange Solid): Starts at ~90% (op=1). Drops to ~60% (op=2), ~38% (op=3), ~22% (op=4), ~12% (op=5). In out-of-domain, ~2% (op=6) and near 0% thereafter.
* `100M, n=2` (Blue Solid): Starts at ~93% (op=1). Drops to ~78% (op=2), ~55% (op=3), ~38% (op=4), ~25% (op=5). In out-of-domain, ~12% (op=6), ~5% (op=7), then near 0%.
* `100M, n=4` (Green Solid): Starts at ~92% (op=1). Drops to ~80% (op=2), ~58% (op=3), ~40% (op=4), ~28% (op=5). In out-of-domain, ~15% (op=6), ~6% (op=7), then near 0%.
**Spatial Grounding & Cross-Reference:**
The legend is clearly placed in the top-right, not overlapping any data points. The color and marker for each series in the plot area consistently match their legend entry. For example, the topmost line at x=1 is the solid blue line with 'x' markers, correctly corresponding to `100M, n=2` in the legend.
### Key Observations
1. **Universal Performance Degradation:** Accuracy decays rapidly and monotonically for all configurations as the number of operations increases. The decline is steepest between 1 and 5 operations.
2. **Model Size Advantage:** The 100M parameter models (solid lines) consistently outperform their 30M parameter counterparts (dotted lines) with the same 'n' value, especially in the 1-5 operation range. The gap narrows as accuracy approaches zero.
3. **Effect of 'n':** For a given model size, higher 'n' values (n=4) generally yield slightly higher accuracy than lower 'n' values (n=1), particularly noticeable in the 100M models in the in-domain region.
4. **Domain Boundary:** Performance for all models is very low (below ~15%) immediately after crossing into the "out-of-domain" region (x > 5.5), and becomes negligible (≤5%) by 7 operations.
5. **Convergence to Zero:** By 8 operations, all models have effectively 0% accuracy, with no visible distinction between them.
### Interpretation
This chart demonstrates a fundamental limitation in the models' ability to maintain accuracy as task complexity (measured by the number of sequential operations) increases. The data suggests:
* **Scalability Challenge:** The models' reasoning or generalization capability does not scale well with the depth of multi-step procedures. There is a sharp phase transition from manageable to impossible tasks around 5-6 operations.
* **Benefit of Scale and Capacity:** Larger models (100M vs. 30M) and models with a higher internal parameter 'n' (which may relate to ensemble size, number of reasoning steps, or capacity) show more robustness, but this advantage is ultimately overwhelmed by increasing operational complexity.
* **Clear Domain Separation:** The vertical line and labels explicitly frame the problem as one of **compositional generalization**. The models perform relatively better on tasks within their training distribution ("in-domain") but fail catastrophically when required to compose operations in novel, "out-of-domain" ways. The near-zero out-of-domain accuracy indicates a lack of systematic generalization.
* **Practical Implication:** For applications requiring more than 5-6 compositional steps, these specific model architectures, regardless of size (30M/100M) or configuration (n=1,2,4), are unreliable. The chart quantifies the operational limit of these systems.