## Heatmap: Recompute Cost (%) Analysis
### Overview
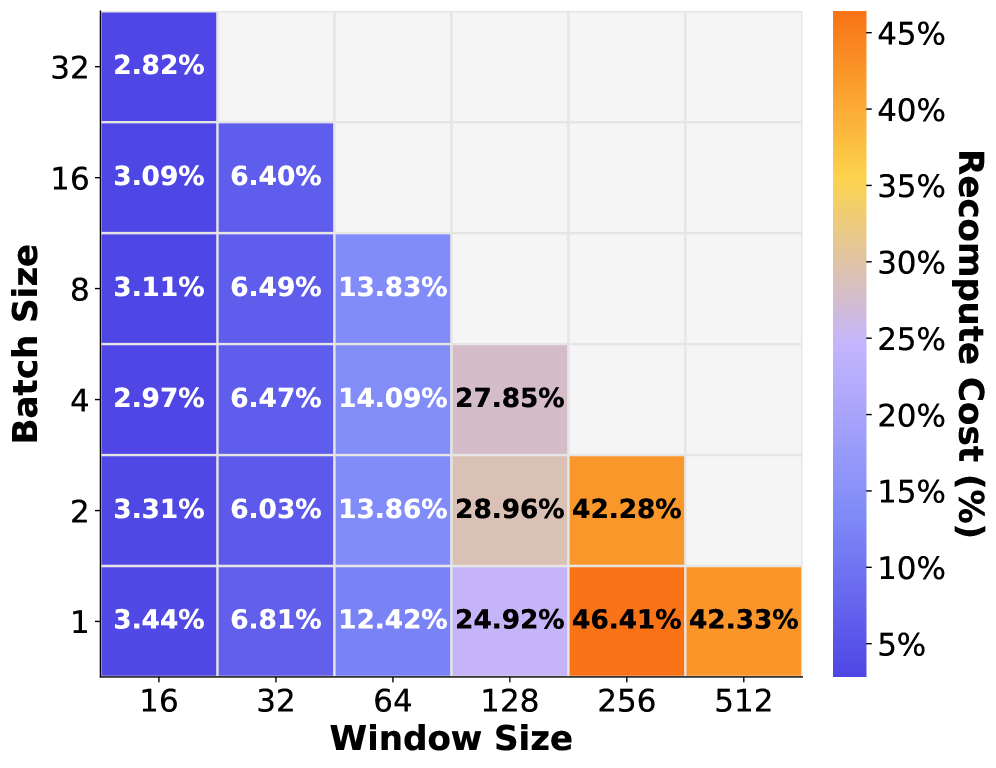
This image is a heatmap visualizing the "Recompute Cost (%)" across various combinations of "Batch Size" and "Window Size." The chart uses a color gradient ranging from blue (low cost, ~5%) to orange (high cost, ~45%). The data is presented in a triangular matrix format, indicating that certain combinations of high batch size and high window size were likely not tested or are not applicable.
### Components/Axes
* **Y-Axis (Vertical):** Labeled "Batch Size." The values are arranged from bottom to top as 1, 2, 4, 8, 16, 32.
* **X-Axis (Horizontal):** Labeled "Window Size." The values are arranged from left to right as 16, 32, 64, 128, 256, 512.
* **Legend:** A vertical color bar on the right side.
* **Bottom (Blue):** Represents ~5% Recompute Cost.
* **Top (Orange):** Represents ~45% Recompute Cost.
* **Data Cells:** Each cell contains a percentage value representing the Recompute Cost for that specific coordinate.
### Detailed Analysis
The data is organized by Window Size (columns). Below is the extraction of values based on the grid coordinates:
**Column 1: Window Size 16**
* Batch 32: 2.82%
* Batch 16: 3.09%
* Batch 8: 3.11%
* Batch 4: 2.97%
* Batch 2: 3.31%
* Batch 1: 3.44%
* *Trend:* Relatively stable, low cost across all batch sizes.
**Column 2: Window Size 32**
* Batch 16: 6.40%
* Batch 8: 6.49%
* Batch 4: 6.47%
* Batch 2: 6.03%
* Batch 1: 6.81%
* *Trend:* Stable, slightly higher than Window Size 16.
**Column 3: Window Size 64**
* Batch 8: 13.83%
* Batch 4: 14.09%
* Batch 2: 13.86%
* Batch 1: 12.42%
* *Trend:* Consistent values around 13-14%.
**Column 4: Window Size 128**
* Batch 4: 27.85%
* Batch 2: 28.96%
* Batch 1: 24.92%
* *Trend:* Significant increase in cost compared to Window Size 64.
**Column 5: Window Size 256**
* Batch 2: 42.28%
* Batch 1: 46.41%
* *Trend:* High cost, approaching the maximum of the scale.
**Column 6: Window Size 512**
* Batch 1: 42.33%
* *Trend:* High cost, though slightly lower than the Batch 1/Window 256 data point.
### Key Observations
* **Primary Trend (Window Size):** There is a strong positive correlation between Window Size and Recompute Cost. As the Window Size increases (moving left to right), the Recompute Cost increases dramatically, shifting from blue (~3%) to orange (~46%).
* **Secondary Trend (Batch Size):** Within a fixed Window Size, the Recompute Cost is relatively stable across different Batch Sizes, though there is a slight tendency for costs to be marginally higher at smaller batch sizes (e.g., Batch 1) compared to larger ones, particularly in the middle-to-high window size ranges.
* **Anomaly:** The value at Window Size 512 / Batch 1 (42.33%) is lower than the value at Window Size 256 / Batch 1 (46.41%). This suggests a non-linear behavior or a potential optimization/saturation point at the highest window size.
### Interpretation
This chart likely represents the performance overhead of **Gradient Checkpointing** (or a similar memory-saving technique) in a machine learning context, specifically for Transformer-based models where "Window Size" (attention span) and "Batch Size" are critical hyperparameters.
* **Memory vs. Compute Trade-off:** The "Recompute Cost" represents the computational penalty paid to save memory. Larger Window Sizes exponentially increase memory pressure, necessitating more frequent recomputation of activations, hence the sharp rise in cost as Window Size increases.
* **Efficiency:** The data demonstrates that smaller batch sizes are less efficient when using recomputation strategies, as the overhead of recomputing activations constitutes a larger percentage of the total compute time compared to larger batch sizes.
* **Operational Limits:** The triangular shape of the heatmap implies that certain configurations (e.g., Batch 32 with Window 512) were likely excluded, possibly due to Out-Of-Memory (OOM) errors, even with recomputation enabled. The system is clearly pushed to its limits as Window Size increases.