\n
## Heatmap: Recompute Cost vs. Batch Size and Window Size
### Overview
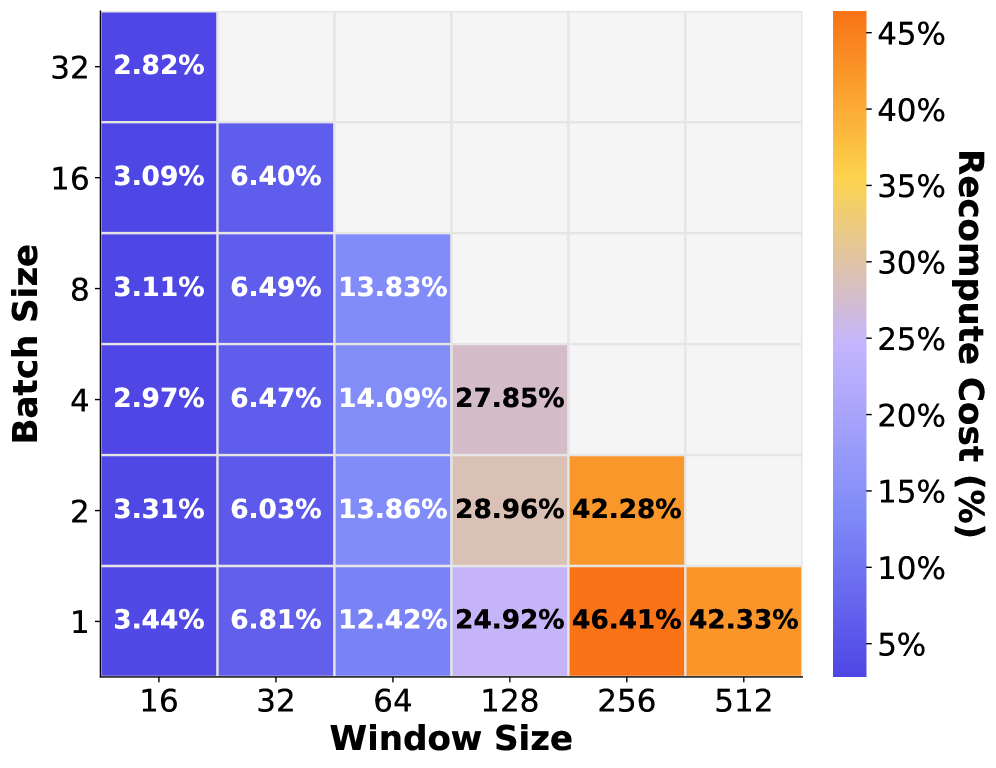
This image presents a heatmap visualizing the relationship between "Window Size" and "Batch Size" in relation to "Recompute Cost (%)". The heatmap displays a grid of cells, each colored according to the corresponding recompute cost percentage. The color scale ranges from approximately 2.82% (dark purple) to 46.41% (dark orange).
### Components/Axes
* **X-axis:** "Window Size" with markers at 16, 32, 64, 128, 256, and 512.
* **Y-axis:** "Batch Size" with markers at 1, 2, 4, 8, 16, and 32.
* **Color Scale (Legend):** Located on the right side of the heatmap, representing "Recompute Cost (%)". The scale ranges from approximately 5% (light blue) to 45% (dark orange).
* **Data Cells:** Each cell represents a specific combination of Window Size and Batch Size, with the recompute cost percentage displayed within the cell.
### Detailed Analysis
The heatmap contains the following data points:
* **Batch Size = 32:**
* Window Size = 16: 2.82%
* Window Size = 32: 6.40%
* **Batch Size = 16:**
* Window Size = 16: 3.09%
* Window Size = 32: 6.49%
* Window Size = 64: 13.83%
* **Batch Size = 8:**
* Window Size = 16: 3.11%
* Window Size = 32: 6.47%
* Window Size = 64: 14.09%
* Window Size = 128: 27.85%
* **Batch Size = 4:**
* Window Size = 16: 2.97%
* Window Size = 32: 6.47%
* Window Size = 64: 13.86%
* Window Size = 128: 28.96%
* Window Size = 256: 42.28%
* **Batch Size = 2:**
* Window Size = 16: 3.31%
* Window Size = 32: 6.03%
* Window Size = 64: 12.42%
* Window Size = 128: 24.92%
* Window Size = 256: 46.41%
* Window Size = 512: 42.33%
* **Batch Size = 1:**
* Window Size = 16: 3.44%
* Window Size = 32: 6.81%
* Window Size = 64: 12.42%
* Window Size = 128: 24.92%
* Window Size = 256: 46.41%
* Window Size = 512: 42.33%
**Trends:**
* As Window Size increases, Recompute Cost generally increases for a given Batch Size.
* For smaller Window Sizes (16, 32), Recompute Cost remains relatively low across all Batch Sizes.
* The highest Recompute Costs are observed with Window Size = 256 and Batch Size = 2, and Window Size = 256 and Batch Size = 1, both at approximately 46.41%.
* Recompute Cost decreases when Window Size = 512 and Batch Size = 1 or 2.
### Key Observations
* The lowest recompute cost is 2.82% when Batch Size is 32 and Window Size is 16.
* There is a noticeable increase in recompute cost as the window size increases beyond 128, especially for smaller batch sizes.
* The recompute cost appears to plateau or even decrease slightly for very large window sizes (512), potentially indicating diminishing returns or optimization benefits.
### Interpretation
The heatmap demonstrates the trade-off between Window Size, Batch Size, and Recompute Cost. Larger Window Sizes generally lead to higher recompute costs, likely due to the increased computational complexity of processing larger data segments. However, the decrease in recompute cost at a Window Size of 512 suggests that there might be a point where larger windows become more efficient, possibly due to better utilization of parallel processing or optimized algorithms.
The Batch Size also influences the recompute cost, but its effect is less pronounced than that of the Window Size. The optimal combination of Window Size and Batch Size depends on the specific application and the available computational resources. This data suggests that for minimizing recompute cost, smaller window sizes and moderate batch sizes are preferable. However, if computational resources are abundant, larger window sizes might be acceptable or even beneficial.
The data suggests a non-linear relationship between the parameters. A simple linear model would not accurately capture the observed behavior, particularly the plateauing effect at larger window sizes. Further investigation might be needed to understand the underlying reasons for this behavior and to identify the optimal parameter settings for different scenarios.