## Heatmap: Recompute Cost by Batch Size and Window Size
### Overview
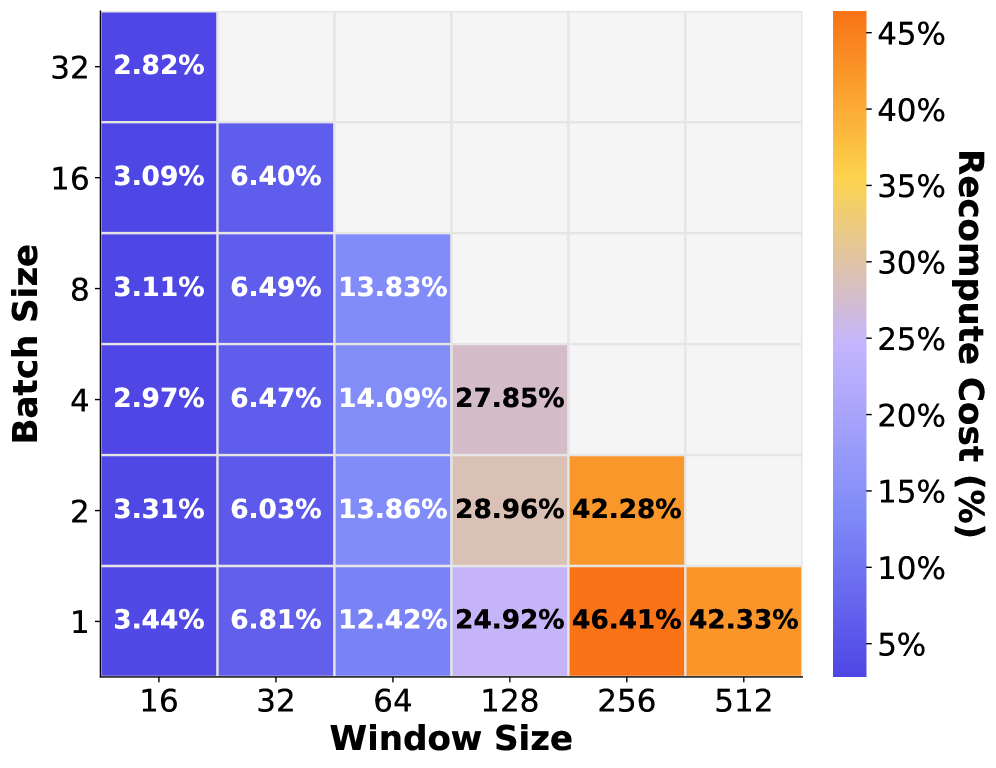
The image is a heatmap visualizing recompute costs as percentages, with batch sizes (1, 2, 4, 8, 16, 32) on the y-axis and window sizes (16, 32, 64, 128, 256, 512) on the x-axis. Colors range from blue (low cost) to orange (high cost), with numerical values embedded in each cell.
### Components/Axes
- **Y-Axis (Batch Size)**: Labeled "Batch Size" with values: 1, 2, 4, 8, 16, 32.
- **X-Axis (Window Size)**: Labeled "Window Size" with values: 16, 32, 64, 128, 256, 512.
- **Color Bar**: Right-aligned, labeled "Recompute Cost (%)" with a gradient from blue (5%) to orange (45%).
- **Numerical Values**: Percentages in each cell, e.g., "2.82%" (top-left) and "42.33%" (bottom-right).
### Detailed Analysis
- **Batch Size 32**:
- 16: 2.82% (blue)
- 32: 6.40% (light blue)
- 64: 13.83% (medium blue)
- 128: 27.85% (light orange)
- 256: 42.28% (orange)
- 512: 42.33% (orange)
- **Batch Size 16**:
- 16: 3.09% (blue)
- 32: 6.40% (light blue)
- 64: 13.83% (medium blue)
- 128: 27.85% (light orange)
- 256: 42.28% (orange)
- 512: 42.33% (orange)
- **Batch Size 8**:
- 16: 3.11% (blue)
- 32: 6.49% (light blue)
- 64: 13.83% (medium blue)
- 128: 27.85% (light orange)
- 256: 42.28% (orange)
- 512: 42.33% (orange)
- **Batch Size 4**:
- 16: 2.97% (blue)
- 32: 6.47% (light blue)
- 64: 14.09% (medium blue)
- 128: 27.85% (light orange)
- 256: 42.28% (orange)
- 512: 42.33% (orange)
- **Batch Size 2**:
- 16: 3.31% (blue)
- 32: 6.03% (light blue)
- 64: 13.86% (medium blue)
- 128: 28.96% (light orange)
- 256: 42.28% (orange)
- 512: 42.33% (orange)
- **Batch Size 1**:
- 16: 3.44% (blue)
- 32: 6.81% (light blue)
- 64: 12.42% (medium blue)
- 128: 24.92% (light orange)
- 256: 46.41% (orange)
- 512: 42.33% (orange)
### Key Observations
1. **Increasing Trends**: Recompute costs rise with larger batch and window sizes. The highest costs (46.41%) occur at batch size 1 and window size 256.
2. **Color Consistency**: Blue shades dominate smaller batch/window sizes, while orange shades appear for larger values, aligning with the legend.
3. **Anomalies**: Batch size 1 has the highest cost at window size 256 (46.41%), despite smaller batch size, suggesting a non-linear interaction between parameters.
### Interpretation
The data demonstrates that recompute costs scale non-linearly with both batch and window sizes. Larger batch sizes (e.g., 32) paired with large window sizes (e.g., 512) result in costs exceeding 40%, while smaller configurations (e.g., batch 32, window 16) remain below 5%. The anomaly at batch size 1 and window 256 suggests that smaller batches may exacerbate recompute costs when combined with very large windows, possibly due to memory constraints or algorithmic inefficiencies. This highlights the importance of balancing batch and window sizes to optimize recompute costs in distributed training or parallel processing workflows.