## Horizontal Bar Chart: Performance Comparison of Different Architectures
### Overview
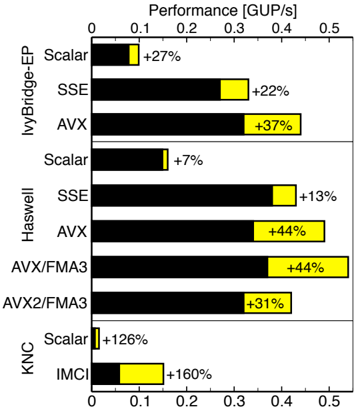
The image is a horizontal bar chart comparing the performance (in GUP/s) of different processor architectures (IvyBridge-EP, Haswell, and KNC) using various instruction sets (Scalar, SSE, AVX, AVX/FMA3, AVX2/FMA3, and IMCI). The chart displays performance as horizontal bars, with black representing the base performance and yellow indicating the percentage increase over a baseline.
### Components/Axes
* **Title:** Performance [GUP/s]
* **X-axis:** Performance, scaled from 0 to 0.5 GUP/s, with tick marks at 0, 0.1, 0.2, 0.3, 0.4, and 0.5.
* **Y-axis:** Processor architectures and instruction sets:
* IvyBridge-EP: Scalar, SSE, AVX
* Haswell: Scalar, SSE, AVX, AVX/FMA3, AVX2/FMA3
* KNC: Scalar, IMCI
* **Bar Colors:**
* Black: Base performance
* Yellow: Percentage increase over the base performance, with the percentage value displayed next to the yellow portion of the bar.
### Detailed Analysis
**IvyBridge-EP:**
* **Scalar:** Black bar extends to approximately 0.06 GUP/s, with a yellow extension indicating a +27% increase.
* **SSE:** Black bar extends to approximately 0.27 GUP/s, with a yellow extension indicating a +22% increase.
* **AVX:** Black bar extends to approximately 0.32 GUP/s, with a yellow extension indicating a +37% increase.
**Haswell:**
* **Scalar:** Black bar extends to approximately 0.04 GUP/s, with a yellow extension indicating a +7% increase.
* **SSE:** Black bar extends to approximately 0.35 GUP/s, with a yellow extension indicating a +13% increase.
* **AVX:** Black bar extends to approximately 0.35 GUP/s, with a yellow extension indicating a +44% increase.
* **AVX/FMA3:** Black bar extends to approximately 0.35 GUP/s, with a yellow extension indicating a +44% increase.
* **AVX2/FMA3:** Black bar extends to approximately 0.42 GUP/s, with a yellow extension indicating a +31% increase.
**KNC:**
* **Scalar:** Black bar extends to approximately 0.03 GUP/s, with a yellow extension indicating a +126% increase.
* **IMCI:** Black bar extends to approximately 0.06 GUP/s, with a yellow extension indicating a +160% increase.
### Key Observations
* For each architecture, using vector instructions (SSE, AVX, etc.) generally results in higher performance than using scalar instructions.
* The KNC architecture shows the largest percentage increases with Scalar and IMCI instructions, although the base performance is lower compared to IvyBridge-EP and Haswell.
* Haswell with AVX/FMA3 and AVX shows the same percentage increase (+44%).
### Interpretation
The chart illustrates the performance gains achieved by utilizing different instruction sets on various processor architectures. The percentage increases highlight the effectiveness of vectorization and specialized instructions (like FMA3 and IMCI) for improving performance. The data suggests that while newer architectures like Haswell generally offer better performance, the choice of instruction set significantly impacts the overall throughput. The KNC architecture, despite having lower base performance, benefits greatly from specific instruction set optimizations, resulting in substantial percentage increases. This indicates that the KNC architecture is highly optimized for the specific workloads tested.