\n
## Bar Chart: Performance Comparison of Different Architectures and Optimizations
### Overview
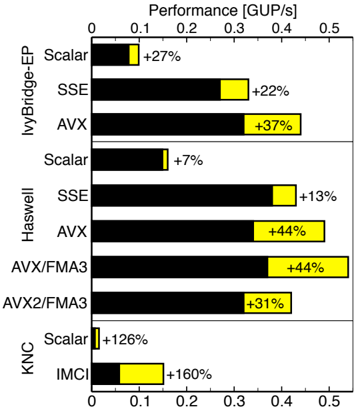
This image presents a bar chart comparing the performance of different processor architectures (IvyBridge-EP, Haswell, KNC) and optimization techniques (Scalar, SSE, AVX, AVX/FMA3, AVX2/FMA3, IMCI). Performance is measured in GUP/s (Giga Updates per Second). Each bar represents the performance of a specific architecture/optimization combination, with a yellow segment indicating the performance improvement relative to a baseline (presumably Scalar for each architecture).
### Components/Axes
* **X-axis:** Performance [GUP/s], ranging from 0 to 0.5.
* **Y-axis:** Lists the processor architectures and optimization techniques:
* IvyBridge-EP: Scalar, SSE, AVX
* Haswell: Scalar, SSE, AVX, AVX/FMA3, AVX2/FMA3
* KNC: Scalar, IMCI
* **Bars:** Represent performance in GUP/s. Black portion represents baseline performance, yellow portion represents performance increase.
* **Labels:** Each bar is labeled with a percentage increase ("+XX%").
### Detailed Analysis
Let's analyze each architecture and optimization combination:
**IvyBridge-EP:**
* **Scalar:** Approximately 0.12 GUP/s.
* **SSE:** Approximately 0.24 GUP/s, +27% improvement over Scalar.
* **AVX:** Approximately 0.32 GUP/s, +37% improvement over Scalar.
**Haswell:**
* **Scalar:** Approximately 0.08 GUP/s.
* **SSE:** Approximately 0.18 GUP/s, +7% improvement over Scalar.
* **AVX:** Approximately 0.31 GUP/s, +44% improvement over Scalar.
* **AVX/FMA3:** Approximately 0.38 GUP/s, +44% improvement over Scalar.
* **AVX2/FMA3:** Approximately 0.34 GUP/s, +31% improvement over Scalar.
**KNC:**
* **Scalar:** Approximately 0.10 GUP/s, +126% improvement over Scalar.
* **IMCI:** Approximately 0.26 GUP/s, +160% improvement over Scalar.
### Key Observations
* **KNC shows the largest performance gains** with IMCI, significantly outperforming Scalar.
* **AVX consistently provides a substantial performance boost** across both IvyBridge-EP and Haswell architectures.
* **Haswell's Scalar performance is lower** than IvyBridge-EP's.
* **AVX/FMA3 and AVX2/FMA3 on Haswell show similar performance**, both with a +44% and +31% improvement respectively.
* The percentage improvements are relative to the *Scalar* implementation for each architecture.
### Interpretation
The data demonstrates the effectiveness of different optimization techniques in improving performance on various processor architectures. The significant gains observed with AVX and IMCI suggest that these techniques are particularly well-suited for accelerating certain types of computations. The KNC architecture, combined with IMCI, exhibits the highest performance, indicating its potential for demanding workloads. The relative performance of Haswell's Scalar implementation being lower than IvyBridge-EP's could be due to differences in microarchitecture or other factors not explicitly stated in the chart. The chart highlights the importance of leveraging architecture-specific optimizations to maximize performance. The use of percentage improvements allows for a direct comparison of the effectiveness of each optimization technique *within* each architecture, but does not allow for a direct comparison *between* architectures without knowing the absolute performance values. The chart suggests that the benefits of AVX/FMA3 and AVX2/FMA3 are similar on the Haswell architecture, but the slight decrease in performance with AVX2/FMA3 could indicate diminishing returns or potential overhead associated with the newer instruction set.