TECHNICAL ASSET FINGERPRINT
4788fe5367175a1c955d5656
Click to view fullscreen
Press ESC or click to close
FOUND IN PAPERS
EXPERT: healer-alpha-free VERSION 1
RUNTIME: free/openrouter/healer-alpha
INTEL_VERIFIED
## Line Charts: Llama-3 Model Layer-wise Answer Accuracy
### Overview
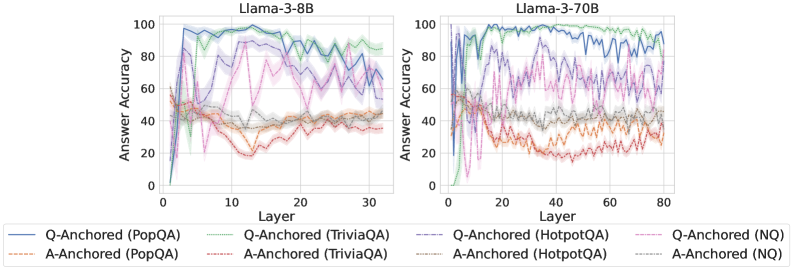
The image displays two side-by-side line charts comparing the "Answer Accuracy" across model layers for two different Large Language Models: **Llama-3-8B** (left chart) and **Llama-3-70B** (right chart). Each chart plots the performance of eight different evaluation configurations, distinguished by anchoring method (Q-Anchored vs. A-Anchored) and dataset (PopQA, TriviaQA, HotpotQA, NQ).
### Components/Axes
* **Chart Titles:** "Llama-3-8B" (left), "Llama-3-70B" (right). Positioned at the top-center of each respective plot area.
* **Y-Axis (Both Charts):** Label is "Answer Accuracy". Scale runs from 0 to 100 in increments of 20.
* **X-Axis (Left Chart - Llama-3-8B):** Label is "Layer". Scale runs from 0 to 30 in increments of 10.
* **X-Axis (Right Chart - Llama-3-70B):** Label is "Layer". Scale runs from 0 to 80 in increments of 20.
* **Legend:** Positioned below both charts, spanning the full width. It defines eight data series using a combination of color and line style (solid vs. dashed).
* **Q-Anchored (Solid Lines):**
* `Q-Anchored (PopQA)`: Solid blue line.
* `Q-Anchored (TriviaQA)`: Solid green line.
* `Q-Anchored (HotpotQA)`: Solid purple line.
* `Q-Anchored (NQ)`: Solid pink line.
* **A-Anchored (Dashed Lines):**
* `A-Anchored (PopQA)`: Dashed orange line.
* `A-Anchored (TriviaQA)`: Dashed red line.
* `A-Anchored (HotpotQA)`: Dashed gray line.
* `A-Anchored (NQ)`: Dashed light blue line.
### Detailed Analysis
**Llama-3-8B Chart (Left):**
* **Trend Verification:** All Q-Anchored (solid) lines show a sharp initial rise from layer 0, peak between layers 5-10, and then exhibit a general downward trend with significant volatility as layers increase towards 30. The A-Anchored (dashed) lines start higher than Q-Anchored at layer 0, show less dramatic peaks, and maintain a more stable, albeit lower, accuracy plateau between 20-50 across most layers.
* **Data Points (Approximate):**
* **Q-Anchored (PopQA - Blue):** Peaks near 100% accuracy around layer 5. Declines to ~60-70% by layer 30.
* **Q-Anchored (TriviaQA - Green):** Peaks near 100% around layer 7. Declines to ~80-90% by layer 30, remaining the highest-performing series.
* **Q-Anchored (HotpotQA - Purple):** Peaks near 90% around layer 8. Shows high volatility, ending near 60% at layer 30.
* **Q-Anchored (NQ - Pink):** Peaks near 90% around layer 10. Declines to ~50-60% by layer 30.
* **A-Anchored Series (All Dashed):** Cluster in the 20-50% accuracy range. `A-Anchored (TriviaQA - Red)` and `A-Anchored (PopQA - Orange)` are often the lowest, hovering near 20-40%. `A-Anchored (HotpotQA - Gray)` and `A-Anchored (NQ - Light Blue)` are slightly higher, often between 30-50%.
**Llama-3-70B Chart (Right):**
* **Trend Verification:** Similar overall pattern to the 8B model but extended over 80 layers. Q-Anchored lines spike early (layers 5-15), then decline with high variance. A-Anchored lines are more stable but lower. The larger model shows higher peak accuracies and more pronounced separation between datasets.
* **Data Points (Approximate):**
* **Q-Anchored (PopQA - Blue):** Peaks near 100% around layer 10. Shows a gradual decline with volatility, ending near 80% at layer 80.
* **Q-Anchored (TriviaQA - Green):** Peaks near 100% around layer 12. Remains very high, mostly above 90%, ending near 95% at layer 80.
* **Q-Anchored (HotpotQA - Purple):** Peaks near 95% around layer 15. Highly volatile, with a wide range (60-90%) in later layers.
* **Q-Anchored (NQ - Pink):** Peaks near 90% around layer 20. Declines to a volatile range of 60-80% in later layers.
* **A-Anchored Series (All Dashed):** Again form a lower, more stable cluster between 20-50%. `A-Anchored (TriviaQA - Red)` is consistently among the lowest (20-35%). `A-Anchored (HotpotQA - Gray)` and `A-Anchored (NQ - Light Blue)` are slightly higher (30-50%).
### Key Observations
1. **Anchoring Method Disparity:** There is a stark and consistent performance gap between Q-Anchored (solid lines) and A-Anchored (dashed lines) configurations across both models and all datasets. Q-Anchored methods achieve much higher peak accuracy.
2. **Layer Sensitivity:** Q-Anchored performance is highly sensitive to layer depth, showing a characteristic "peak and decay" pattern. Optimal performance is found in early-to-mid layers (roughly layers 5-20).
3. **Dataset Hierarchy:** A clear performance hierarchy by dataset is visible, especially in the Q-Anchored results. `TriviaQA` (green) consistently yields the highest accuracy, followed generally by `PopQA` (blue), then `HotpotQA` (purple) and `NQ` (pink).
4. **Model Scale Effect:** The Llama-3-70B model not only operates over more layers but also demonstrates higher sustained accuracy for its top-performing configurations (e.g., Q-Anchored TriviaQA remains >90% across most layers) compared to the 8B model.
5. **Volatility:** The Q-Anchored lines, particularly for `HotpotQA` and `NQ`, exhibit significant layer-to-layer volatility, suggesting unstable representations for those tasks at certain depths.
### Interpretation
This data suggests a fundamental difference in how information is utilized across a model's layers depending on the prompting or evaluation strategy ("anchoring"). The **Q-Anchored** approach (likely using a question-based prompt) appears to leverage early and middle layers for peak factual recall, with performance degrading in deeper layers, possibly due to over-processing or task misalignment. In contrast, the **A-Anchored** approach (likely using an answer-based or different prompt format) yields more stable but significantly weaker performance across all layers, indicating it may not effectively activate the model's parametric knowledge.
The **dataset hierarchy** (`TriviaQA` > `PopQA` > `HotpotQA`/`NQ`) reflects the nature of the knowledge required: `TriviaQA` likely involves more straightforward, encyclopedic facts that the model has memorized well, while `HotpotQA` (multi-hop reasoning) and `NQ` (natural questions) present more complex or varied challenges.
The **"peak and decay"** pattern for Q-Anchored methods is a critical finding. It implies that for factual recall tasks, the most useful representations are not in the final layers but in the intermediate ones. This has practical implications for model editing, knowledge extraction, or interpretability techniques, which should target these mid-layer regions. The increased stability and higher baseline of the 70B model suggest that scale improves both the capacity for knowledge storage and the robustness of its retrieval across layers.
DECODING INTELLIGENCE...