## Line Chart: NDCG@10% vs. Dimensions
### Overview
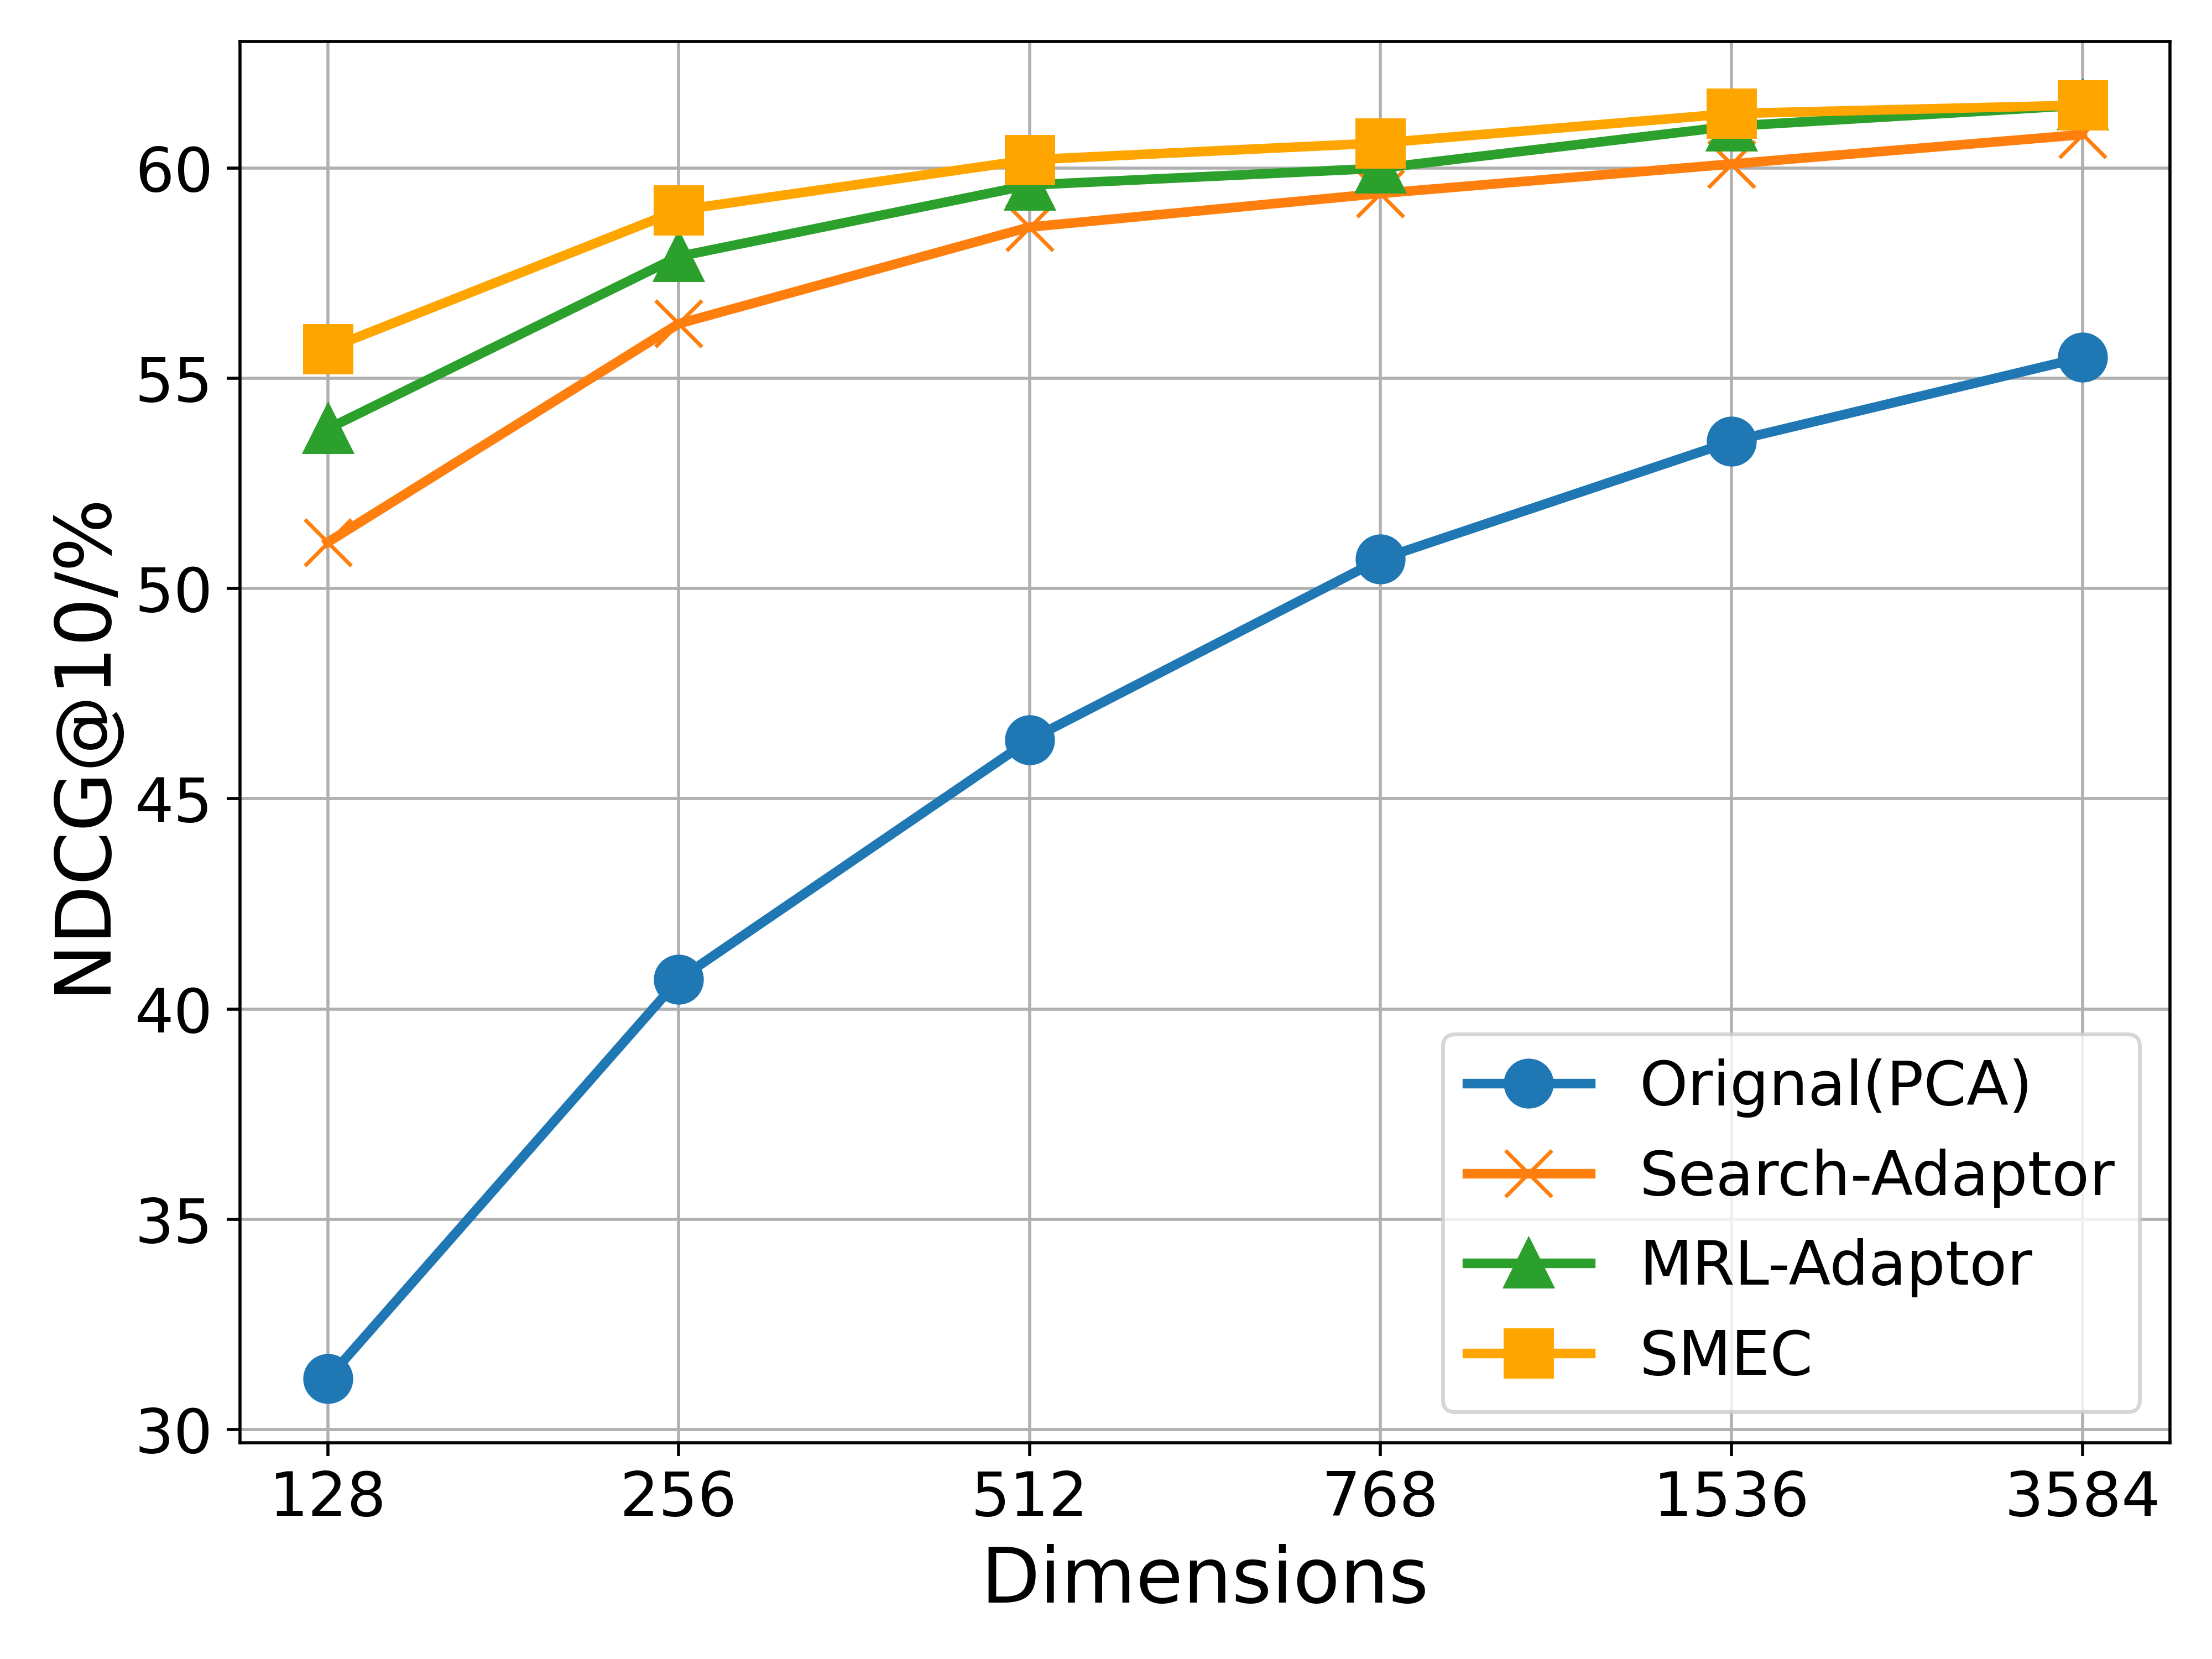
This image presents a line chart comparing the performance of four different methods – Original(PCA), Search-Adaptor, MRL-Adaptor, and SMEC – across varying dimensions. The performance metric is NDCG@10%, which likely represents Normalized Discounted Cumulative Gain at 10%. The chart illustrates how the performance of each method changes as the dimensionality of the data increases.
### Components/Axes
* **X-axis:** Dimensions, ranging from 128 to 3584. The axis markers are: 128, 256, 512, 768, 1536, 3584.
* **Y-axis:** NDCG@10%, ranging from 30 to 60. The axis markers are: 30, 35, 40, 45, 50, 55, 60.
* **Legend:** Located in the top-right corner of the chart.
* Original(PCA) - Blue circle
* Search-Adaptor - Orange cross
* MRL-Adaptor - Green triangle
* SMEC - Yellow square
### Detailed Analysis
* **Original(PCA):** This line (blue) starts at approximately 31% at 128 dimensions and steadily increases to approximately 54% at 3584 dimensions. The line exhibits a consistent upward slope, indicating improved performance with increasing dimensions.
* 128 Dimensions: ~31%
* 256 Dimensions: ~37%
* 512 Dimensions: ~46%
* 768 Dimensions: ~50%
* 1536 Dimensions: ~53%
* 3584 Dimensions: ~54%
* **Search-Adaptor:** This line (orange) begins at approximately 50% at 128 dimensions and rises to approximately 61% at 3584 dimensions. The slope is initially steeper, then flattens out.
* 128 Dimensions: ~50%
* 256 Dimensions: ~56%
* 512 Dimensions: ~59%
* 768 Dimensions: ~60%
* 1536 Dimensions: ~60%
* 3584 Dimensions: ~61%
* **MRL-Adaptor:** This line (green) starts at approximately 55% at 128 dimensions and increases to approximately 60% at 3584 dimensions. The line is relatively flat, indicating minimal performance improvement with increasing dimensions.
* 128 Dimensions: ~55%
* 256 Dimensions: ~57%
* 512 Dimensions: ~58%
* 768 Dimensions: ~59%
* 1536 Dimensions: ~60%
* 3584 Dimensions: ~60%
* **SMEC:** This line (yellow) begins at approximately 55% at 128 dimensions and rises to approximately 61% at 3584 dimensions. The line is relatively flat, similar to MRL-Adaptor, but slightly higher in overall performance.
* 128 Dimensions: ~55%
* 256 Dimensions: ~57%
* 512 Dimensions: ~59%
* 768 Dimensions: ~60%
* 1536 Dimensions: ~60%
* 3584 Dimensions: ~61%
### Key Observations
* The Original(PCA) method shows the most significant improvement in NDCG@10% as the number of dimensions increases.
* Search-Adaptor and SMEC achieve the highest NDCG@10% scores, consistently above 60% at higher dimensions.
* MRL-Adaptor exhibits the least improvement with increasing dimensions, plateauing around 60%.
* The performance gap between the methods narrows at higher dimensions.
### Interpretation
The data suggests that increasing the dimensionality of the data generally improves the performance of these methods, as measured by NDCG@10%. However, the rate of improvement varies significantly. The Original(PCA) method benefits the most from increased dimensionality, while the Search-Adaptor, MRL-Adaptor, and SMEC methods show diminishing returns.
The fact that Search-Adaptor and SMEC consistently outperform the other methods, particularly at higher dimensions, suggests that these methods are more effective at leveraging the information contained in higher-dimensional data. The plateauing of MRL-Adaptor indicates that it may be limited by its ability to effectively utilize the increased dimensionality.
The Original(PCA) method's consistent improvement suggests that it is a good baseline approach, but it may not be able to achieve the same level of performance as the more sophisticated adaptation methods. The convergence of the lines at higher dimensions suggests that there may be a point of diminishing returns, where further increasing the dimensionality does not lead to significant performance gains. This could be due to factors such as the curse of dimensionality or the limitations of the evaluation metric.