## Line Chart: Performance of Dimensionality Reduction Methods on NDCG@10
### Overview
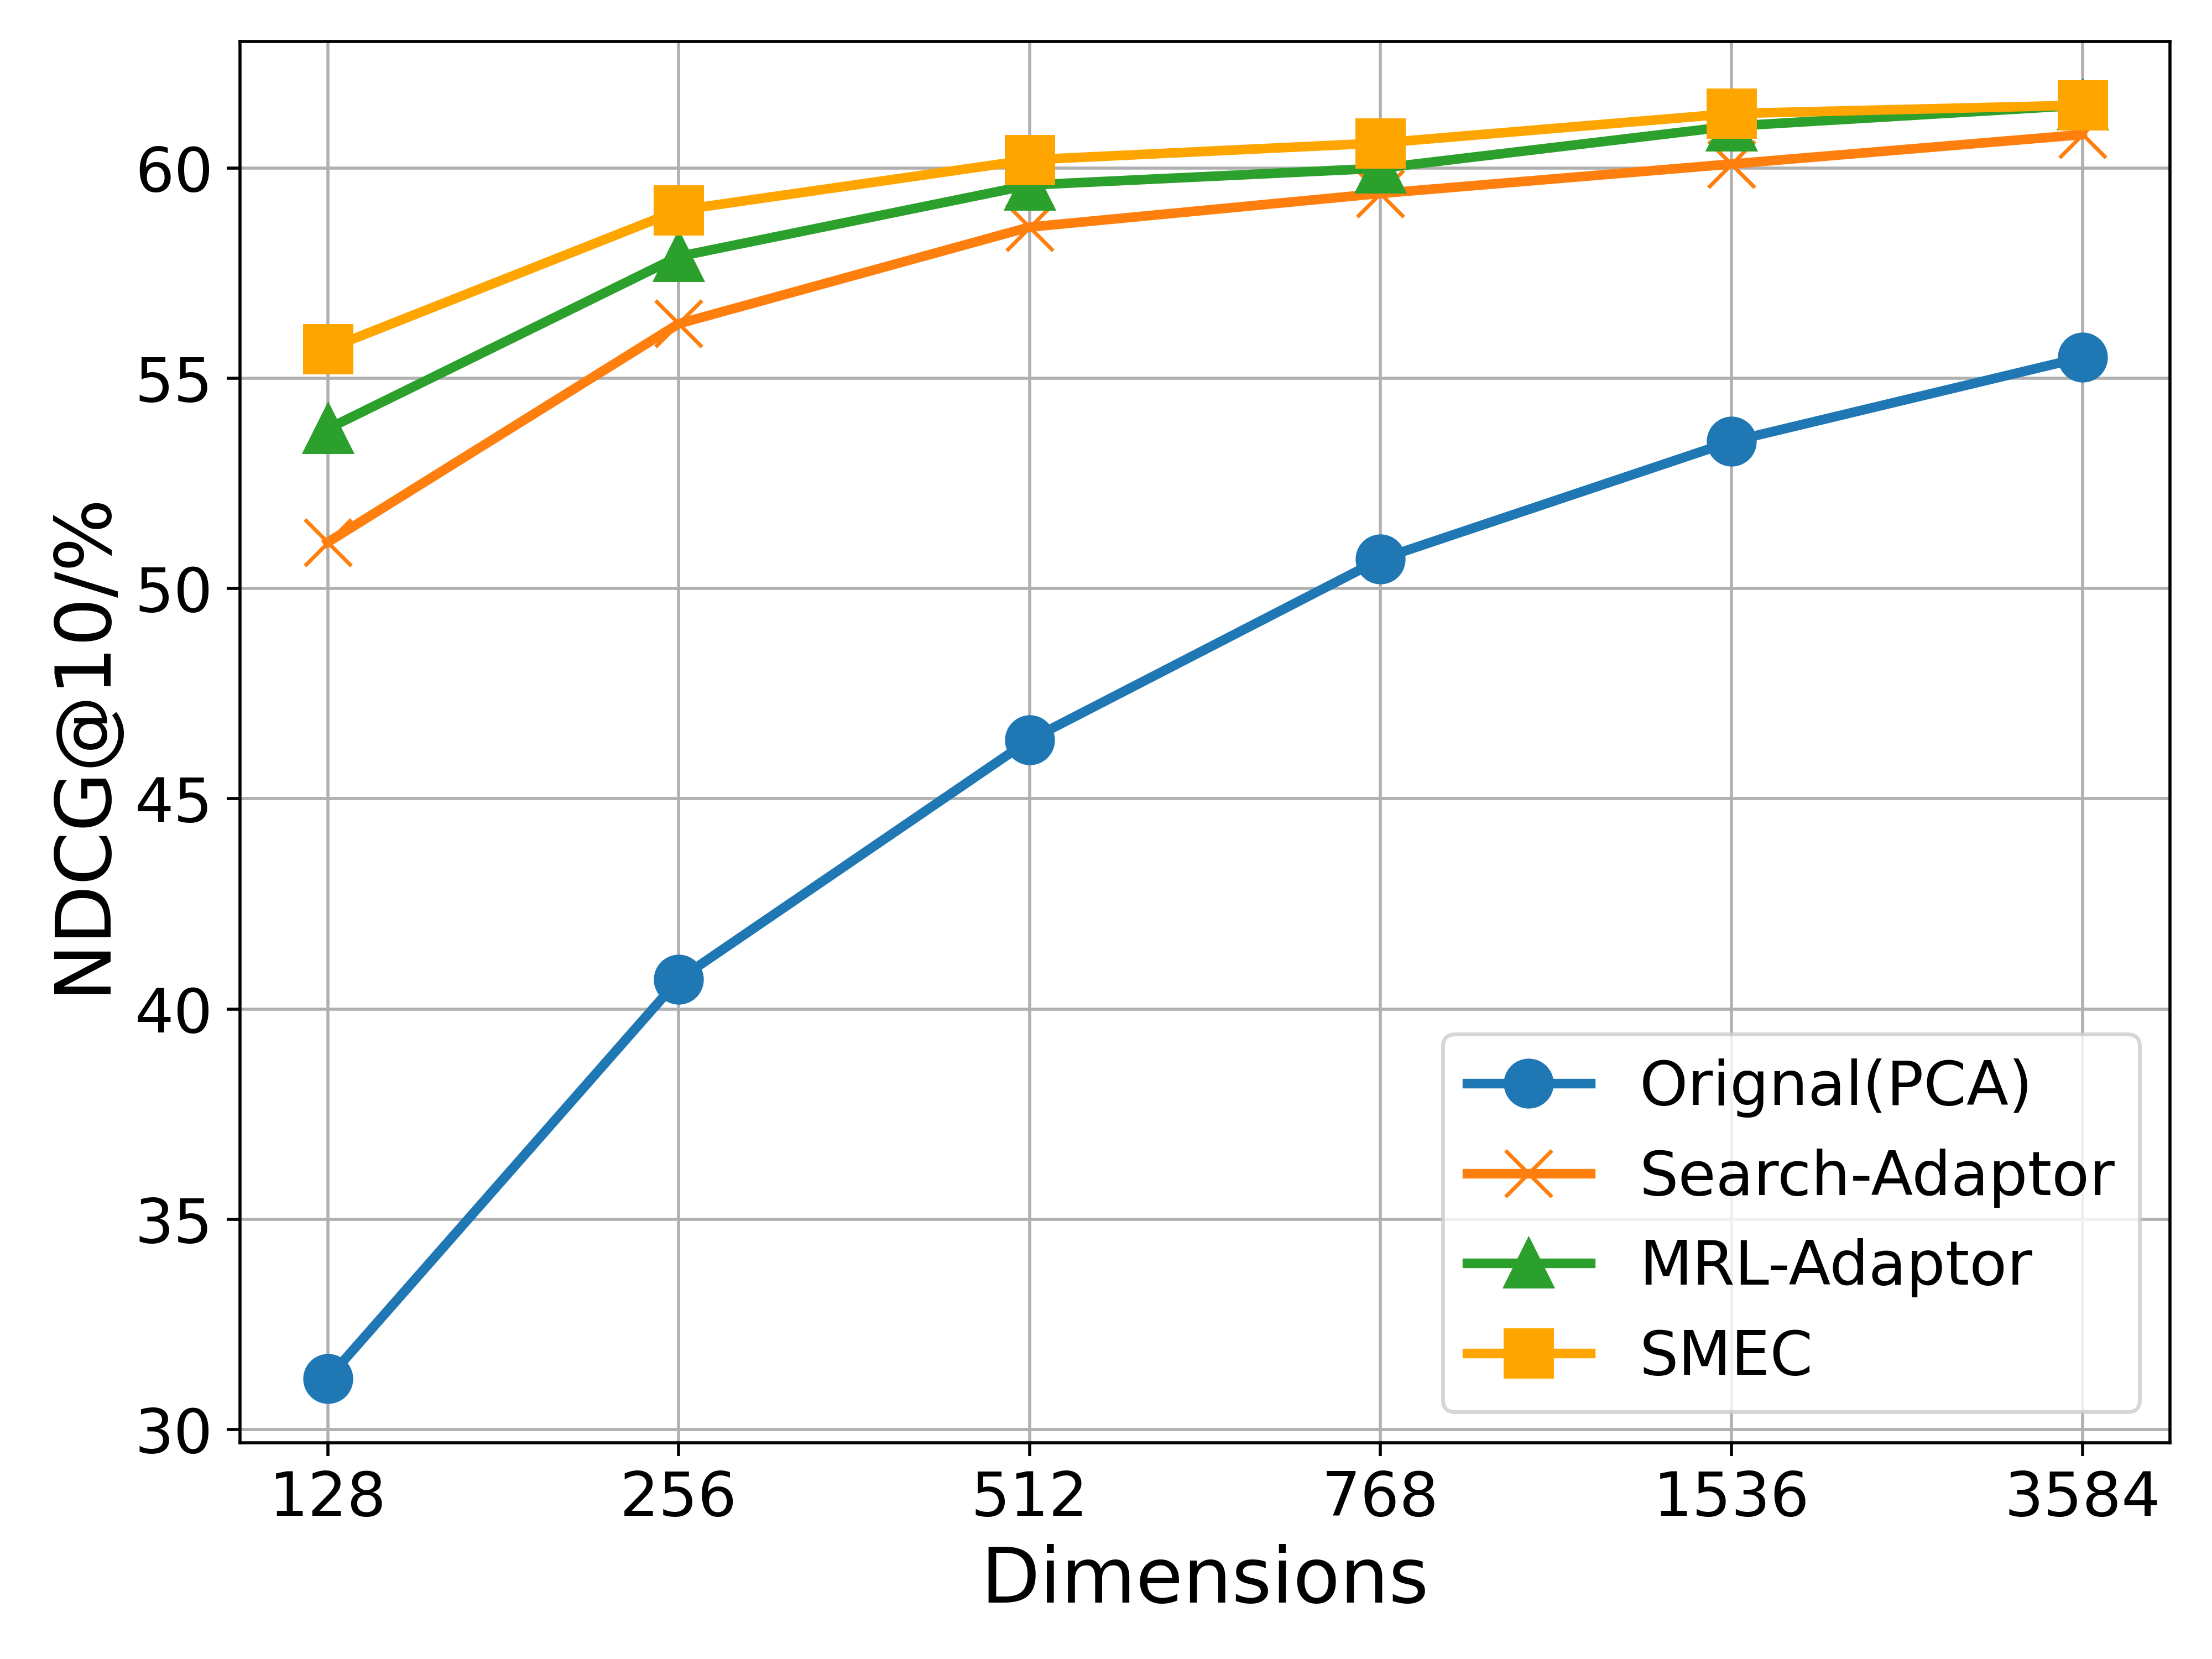
This is a line chart comparing the performance of four different dimensionality reduction or adaptation methods across varying embedding dimensions. The performance metric is NDCG@10 (Normalized Discounted Cumulative Gain at rank 10), expressed as a percentage. The chart demonstrates how each method's effectiveness scales with increased dimensionality.
### Components/Axes
* **X-Axis (Horizontal):** Labeled "Dimensions". It represents the dimensionality of the embedding space. The axis markers are at specific, non-linear intervals: 128, 256, 512, 768, 1536, and 3584.
* **Y-Axis (Vertical):** Labeled "NDCG@10/%". It represents the ranking performance score as a percentage. The scale ranges from 30 to approximately 62, with major gridlines at intervals of 5 (30, 35, 40, 45, 50, 55, 60).
* **Legend:** Located in the bottom-right quadrant of the chart area. It contains four entries, each associating a line color and marker style with a method name:
1. **Blue line with circle markers:** "Orignal(PCA)" [sic - likely a typo for "Original"].
2. **Orange line with 'x' markers:** "Search-Adaptor".
3. **Green line with triangle markers:** "MRL-Adaptor".
4. **Yellow/Orange line with square markers:** "SMEC".
### Detailed Analysis
**Trend Verification & Data Point Extraction:**
All four data series show a positive trend: NDCG@10 increases as the number of dimensions increases. The rate of improvement generally slows down (diminishing returns) at higher dimensions.
1. **Orignal(PCA) [Blue, Circle]:**
* **Trend:** Steep, consistent upward slope across the entire range. It shows the most dramatic relative improvement.
* **Approximate Data Points:**
* 128 Dimensions: ~31%
* 256 Dimensions: ~40.5%
* 512 Dimensions: ~46.5%
* 768 Dimensions: ~50.5%
* 1536 Dimensions: ~53.5%
* 3584 Dimensions: ~55.5%
2. **Search-Adaptor [Orange, 'x']:**
* **Trend:** Starts lower than MRL-Adaptor and SMEC, rises sharply until 512 dimensions, then continues to rise more gradually. It remains the lowest-performing of the three adaptor methods throughout.
* **Approximate Data Points:**
* 128 Dimensions: ~51%
* 256 Dimensions: ~56.5%
* 512 Dimensions: ~58.5%
* 768 Dimensions: ~59.5%
* 1536 Dimensions: ~60.2%
* 3584 Dimensions: ~60.8%
3. **MRL-Adaptor [Green, Triangle]:**
* **Trend:** Starts above Search-Adaptor but below SMEC. Follows a similar growth curve, rising quickly initially and then plateauing. It consistently performs between Search-Adaptor and SMEC.
* **Approximate Data Points:**
* 128 Dimensions: ~54%
* 256 Dimensions: ~58%
* 512 Dimensions: ~59.5%
* 768 Dimensions: ~60%
* 1536 Dimensions: ~61%
* 3584 Dimensions: ~61.5%
4. **SMEC [Yellow/Orange, Square]:**
* **Trend:** The top-performing method at all dimension levels. It shows a strong initial increase and maintains a slight but consistent lead over MRL-Adaptor.
* **Approximate Data Points:**
* 128 Dimensions: ~56%
* 256 Dimensions: ~59%
* 512 Dimensions: ~60.2%
* 768 Dimensions: ~60.8%
* 1536 Dimensions: ~61.5%
* 3584 Dimensions: ~61.8%
### Key Observations
1. **Performance Hierarchy:** A clear and consistent performance hierarchy is maintained across all dimensions: SMEC > MRL-Adaptor > Search-Adaptor > Orignal(PCA).
2. **Diminishing Returns:** All methods exhibit diminishing returns. The most significant performance gains occur when increasing dimensions from 128 to 512. Beyond 768 dimensions, the curves flatten considerably.
3. **Gap Narrowing:** The performance gap between the three adaptor methods (SMEC, MRL, Search) and the baseline PCA method narrows as dimensions increase. At 128 dimensions, the gap is ~25 percentage points; at 3584 dimensions, it narrows to ~6 percentage points.
4. **Typo in Legend:** The legend contains a likely typo: "Orignal(PCA)" should probably read "Original(PCA)".
### Interpretation
This chart evaluates the efficacy of different techniques for optimizing dense vector representations for retrieval tasks (as measured by NDCG@10). The data suggests several key insights:
* **Superiority of Adaptor Methods:** The three specialized adaptor methods (SMEC, MRL-Adaptor, Search-Adaptor) significantly outperform the standard PCA baseline, especially at lower dimensions. This indicates that task-specific adaptation is far more effective than generic dimensionality reduction for preserving ranking quality.
* **SMEC as the State-of-the-Art:** SMEC demonstrates the highest effectiveness, suggesting its underlying methodology (likely a more sophisticated compression or adaptation technique) is the most successful at maintaining retrieval performance while reducing dimensionality.
* **Scalability vs. Efficiency Trade-off:** While all methods improve with more dimensions, the flattening curves after 512-768 dimensions imply a practical efficiency frontier. For resource-constrained applications, using 512 or 768 dimensions with an adaptor like SMEC may offer the best balance between performance and computational cost, as further increases yield minimal gains.
* **Baseline Limitation:** The steep slope of the PCA line shows it is highly sensitive to dimensionality, performing poorly in very low-dimensional spaces. The adaptors are much more robust, maintaining high performance even at 128 dimensions, which is crucial for applications requiring extreme compression.
In summary, the chart provides strong evidence that for retrieval-oriented tasks, employing specialized adaptation techniques like SMEC is crucial for achieving high performance with compact vector representations, and that there is a clear point of diminishing returns in scaling up dimensionality.