## Line Chart: Function Calls vs. Failed LLMs
### Overview
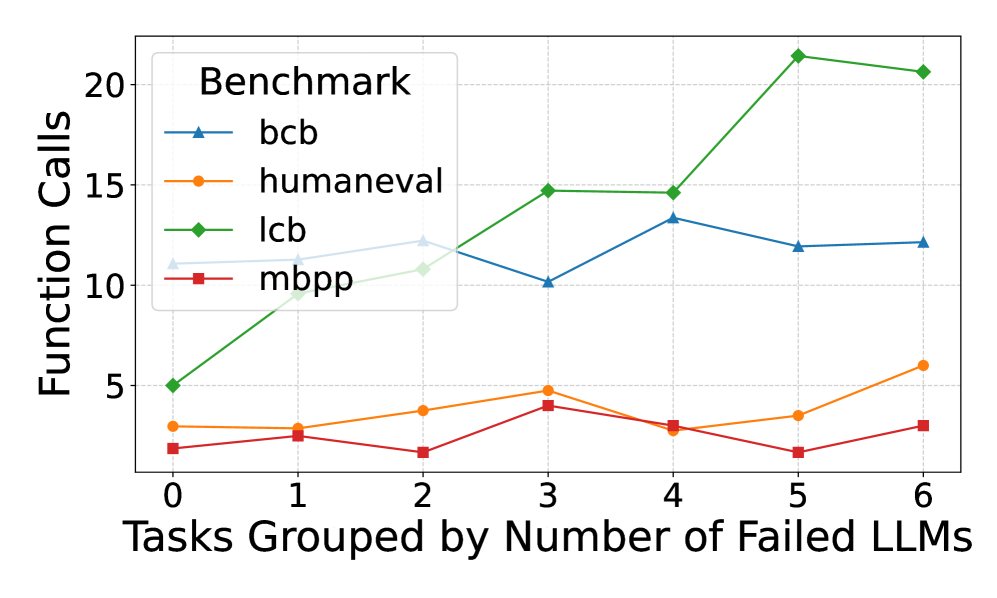
The image is a line chart comparing the number of function calls for different benchmarks (bcb, humaneval, lcb, and mbpp) against the number of failed Large Language Models (LLMs). The x-axis represents the number of failed LLMs, grouped by tasks, ranging from 0 to 6. The y-axis represents the number of function calls, ranging from 0 to 20.
### Components/Axes
* **Title**: None explicitly present in the image.
* **X-axis Title**: Tasks Grouped by Number of Failed LLMs
* **X-axis Scale**: 0, 1, 2, 3, 4, 5, 6
* **Y-axis Title**: Function Calls
* **Y-axis Scale**: 0, 5, 10, 15, 20
* **Legend**: Located in the top-left corner, enclosed in a box.
* **bcb**: Blue line with triangle markers.
* **humaneval**: Orange line with circle markers.
* **lcb**: Green line with diamond markers.
* **mbpp**: Red line with square markers.
### Detailed Analysis
* **bcb (Blue, Triangle)**: Starts at approximately 3 function calls with 0 failed LLMs. Increases to approximately 12 function calls with 2 failed LLMs. Decreases to approximately 10 function calls with 3 failed LLMs. Increases to approximately 14 function calls with 4 failed LLMs. Decreases to approximately 12 function calls with 5 and 6 failed LLMs.
* (0, 3), (1, 3), (2, 12), (3, 10), (4, 14), (5, 12), (6, 12)
* **humaneval (Orange, Circle)**: Starts at approximately 3 function calls with 0 failed LLMs. Increases gradually to approximately 6 function calls with 6 failed LLMs.
* (0, 3), (1, 3), (2, 4), (3, 5), (4, 3), (5, 4), (6, 6)
* **lcb (Green, Diamond)**: Starts at approximately 5 function calls with 0 failed LLMs. Increases sharply to approximately 15 function calls with 3 failed LLMs. Remains relatively stable at approximately 15 function calls until 4 failed LLMs. Increases sharply to approximately 21 function calls with 5 failed LLMs. Decreases slightly to approximately 20 function calls with 6 failed LLMs.
* (0, 5), (1, 10), (2, 11), (3, 15), (4, 15), (5, 21), (6, 20)
* **mbpp (Red, Square)**: Starts at approximately 2 function calls with 0 failed LLMs. Increases to approximately 5 function calls with 3 failed LLMs. Decreases to approximately 3 function calls with 4 failed LLMs. Decreases to approximately 2 function calls with 6 failed LLMs.
* (0, 2), (1, 3), (2, 2), (3, 5), (4, 3), (5, 2), (6, 3)
### Key Observations
* The lcb benchmark shows the most significant increase in function calls as the number of failed LLMs increases, peaking at 21 function calls with 5 failed LLMs.
* The humaneval benchmark shows a gradual increase in function calls as the number of failed LLMs increases.
* The bcb benchmark shows an initial increase in function calls, followed by a decrease and then stabilization.
* The mbpp benchmark shows a relatively low number of function calls compared to the other benchmarks, with some fluctuation as the number of failed LLMs increases.
### Interpretation
The chart illustrates the relationship between the number of failed LLMs and the number of function calls required for different benchmarks. The lcb benchmark appears to be the most sensitive to the number of failed LLMs, requiring significantly more function calls as the number of failures increases. The humaneval benchmark shows a more consistent, gradual increase, suggesting a different type of dependency on LLM success. The bcb and mbpp benchmarks show more complex patterns, potentially indicating different strategies or sensitivities to LLM failures. The data suggests that the performance and resource requirements of different benchmarks vary significantly depending on the reliability of the underlying LLMs.