## Line Chart: Function Calls vs. Failed LLMs
### Overview
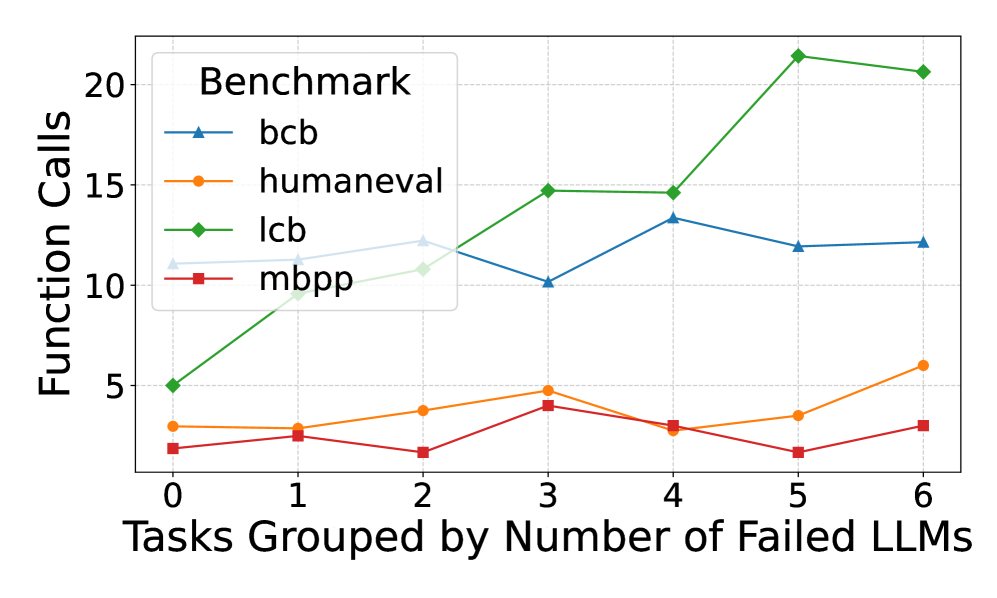
This line chart depicts the relationship between the number of tasks grouped by the number of failed Large Language Models (LLMs) and the corresponding number of function calls. Four different benchmarks are compared: `bcb`, `humaneval`, `lcb`, and `mbpp`. The x-axis represents the grouping of tasks based on the number of failed LLMs (ranging from 0 to 6), while the y-axis represents the number of function calls (ranging from 0 to 20).
### Components/Axes
* **Title:** Not explicitly present, but the chart represents "Function Calls vs. Failed LLMs".
* **X-axis Label:** "Tasks Grouped by Number of Failed LLMs"
* **X-axis Markers:** 0, 1, 2, 3, 4, 5, 6
* **Y-axis Label:** "Function Calls"
* **Y-axis Scale:** 0 to 20, with increments of 5.
* **Legend:** Located in the top-left corner.
* `bcb` - Blue line with triangle markers.
* `humaneval` - Orange line with circle markers.
* `lcb` - Green line with diamond markers.
* `mbpp` - Red line with square markers.
### Detailed Analysis
Here's a breakdown of each benchmark's trend and data points:
* **bcb (Blue Line):** The line initially slopes upward from x=0 to x=3, then plateaus and slightly declines from x=3 to x=6.
* x=0: ~10 function calls
* x=1: ~11 function calls
* x=2: ~12 function calls
* x=3: ~15 function calls
* x=4: ~13 function calls
* x=5: ~12 function calls
* x=6: ~11 function calls
* **humaneval (Orange Line):** The line exhibits a generally increasing trend from x=0 to x=6, with some fluctuations.
* x=0: ~2 function calls
* x=1: ~2 function calls
* x=2: ~3 function calls
* x=3: ~4 function calls
* x=4: ~3 function calls
* x=5: ~5 function calls
* x=6: ~7 function calls
* **lcb (Green Line):** This line shows a strong upward trend, particularly from x=0 to x=5, then plateaus.
* x=0: ~6 function calls
* x=1: ~8 function calls
* x=2: ~12 function calls
* x=3: ~15 function calls
* x=4: ~13 function calls
* x=5: ~21 function calls
* x=6: ~21 function calls
* **mbpp (Red Line):** The line remains relatively flat throughout the range of x-values, with minor fluctuations.
* x=0: ~3 function calls
* x=1: ~3 function calls
* x=2: ~2 function calls
* x=3: ~3 function calls
* x=4: ~2 function calls
* x=5: ~2 function calls
* x=6: ~3 function calls
### Key Observations
* `lcb` consistently requires the highest number of function calls across all task groupings.
* `mbpp` consistently requires the lowest number of function calls.
* `bcb` shows an initial increase in function calls with more failed LLMs, but then stabilizes.
* `humaneval` shows a steady increase in function calls as the number of failed LLMs increases.
* The most significant increase in function calls for `lcb` occurs between x=0 and x=5.
### Interpretation
The chart suggests that the number of function calls needed to complete tasks varies significantly depending on the benchmark used. The `lcb` benchmark appears to be the most complex, requiring substantially more function calls than the other benchmarks, and its complexity increases with the number of failed LLMs. `mbpp` is the simplest, requiring a minimal number of function calls regardless of the number of failed LLMs. The increasing trend of `humaneval` suggests that as tasks become more challenging (indicated by more LLM failures), the number of function calls needed to resolve them also increases. The initial increase and subsequent stabilization of `bcb` could indicate a point of diminishing returns, where adding more LLMs beyond a certain failure threshold doesn't significantly increase the number of function calls. This data could be used to evaluate the efficiency and complexity of different benchmarks and to understand how LLM failures impact the resource requirements of task completion.