## Line Graph: Benchmark Performance by Task Group
### Overview
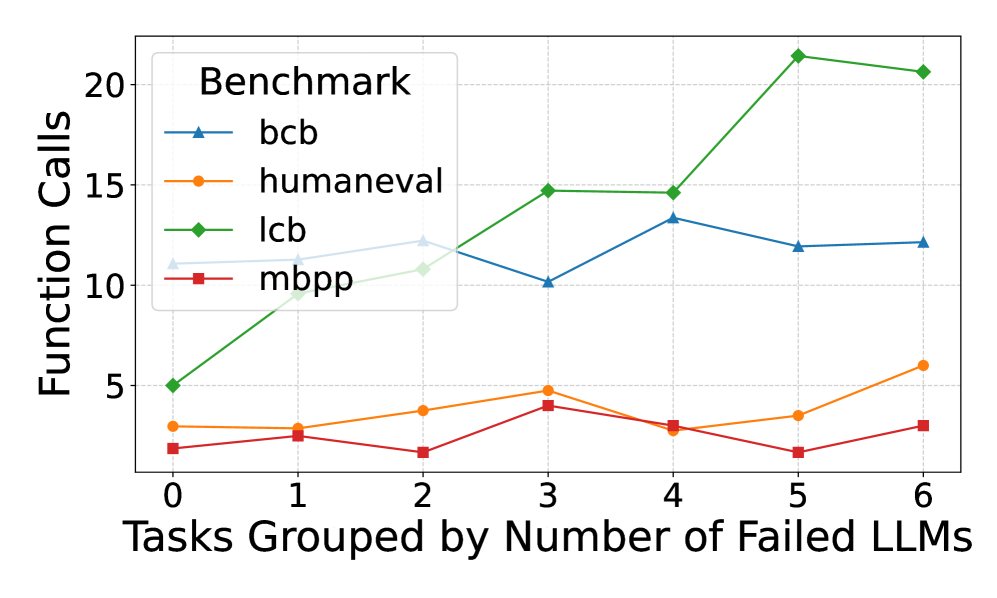
The image displays a line graph comparing four benchmarks (bcb, humaneval, lcb, mbpp) across tasks grouped by the number of failed LLMs (0–6). The y-axis measures "Function Calls," while the x-axis categorizes tasks by failure counts. The legend is positioned in the top-left corner, with distinct colors and markers for each benchmark.
### Components/Axes
- **X-axis**: "Tasks Grouped by Number of Failed LLMs" (0–6, integer intervals).
- **Y-axis**: "Function Calls" (0–20, linear scale).
- **Legend**:
- **bcb**: Blue line with triangle markers.
- **humaneval**: Orange line with circle markers.
- **lcb**: Green line with diamond markers.
- **mbpp**: Red line with square markers.
- **Grid**: Dotted lines for reference.
### Detailed Analysis
1. **lcb (Green Diamonds)**:
- Starts at ~5 function calls (x=0).
- Sharp increase to ~10 (x=1), then ~15 (x=3).
- Peaks at ~21 (x=5), then slightly declines to ~20.5 (x=6).
- **Trend**: Steep upward trajectory with a plateau at higher x-values.
2. **bcb (Blue Triangles)**:
- Begins at ~10 (x=0), dips to ~10 (x=3).
- Rises to ~13.5 (x=4), then stabilizes at ~12–12.2 (x=5–6).
- **Trend**: Moderate fluctuations with a peak at x=4.
3. **humaneval (Orange Circles)**:
- Starts at ~3 (x=0), fluctuates between 3–5 (x=1–4).
- Ends at ~6 (x=6).
- **Trend**: Gradual increase with minor volatility.
4. **mbpp (Red Squares)**:
- Starts at ~2 (x=0), peaks at ~4 (x=3).
- Drops to ~2 (x=5), then rises to ~3.5 (x=6).
- **Trend**: Bimodal with a mid-range peak and late recovery.
### Key Observations
- **lcb** dominates in function calls, especially at higher x-values (x=5–6).
- **bcb** and **humaneval** show moderate performance, with bcb peaking earlier.
- **mbpp** remains the lowest-performing benchmark throughout.
- All benchmarks exhibit variability, but lcb’s growth is most pronounced.
### Interpretation
The data suggests that the **lcb benchmark** is the most resource-intensive, requiring significantly more function calls as task difficulty (failed LLMs) increases. This could indicate lcb’s sensitivity to complex tasks or its design for high-stakes scenarios. In contrast, **mbpp** remains the least demanding, possibly reflecting simpler or more constrained problem sets. The divergence in trends highlights how benchmarks may prioritize different aspects of task execution (e.g., accuracy vs. efficiency). The stability of humaneval and bcb suggests they balance performance across varying task complexities.