## Heatmap: Performance vs. Number of Feedback Repairs and Initial Programs
### Overview
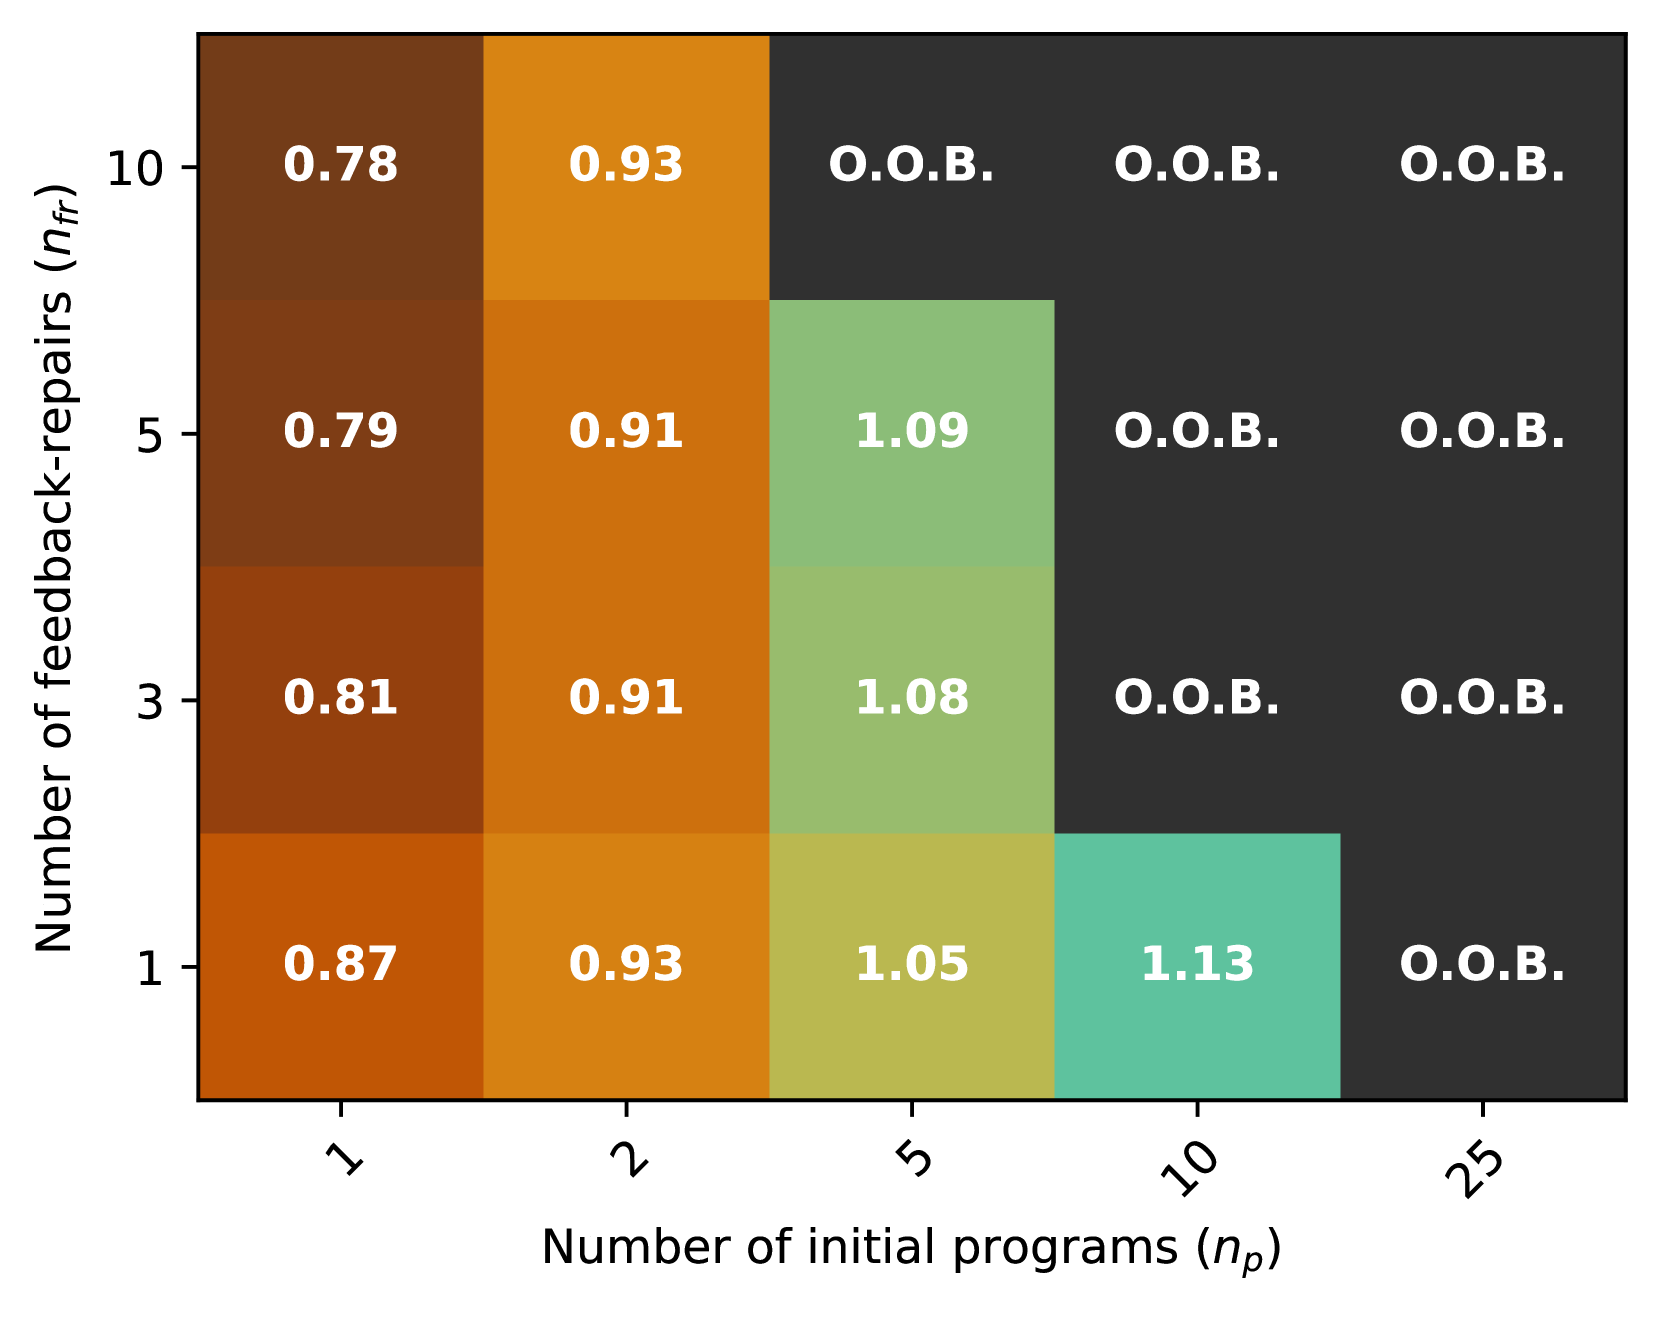
The image is a heatmap visualizing performance based on the number of feedback repairs (nfr) and the number of initial programs (np). The heatmap uses color to represent performance values, with specific numerical values displayed within each cell. "O.O.B." is also used as a value.
### Components/Axes
* **X-axis (Horizontal):** Number of initial programs (np) with values 1, 2, 5, 10, and 25.
* **Y-axis (Vertical):** Number of feedback-repairs (nfr) with values 1, 3, 5, and 10.
* **Cells:** Each cell represents a combination of nfr and np, with a color and a numerical value (or "O.O.B.") indicating performance.
### Detailed Analysis
The heatmap displays performance values for different combinations of the number of feedback repairs (nfr) and the number of initial programs (np). The values are as follows:
* **nfr = 10:**
* np = 1: 0.78 (brown)
* np = 2: 0.93 (orange)
* np = 5: O.O.B. (dark gray)
* np = 10: O.O.B. (dark gray)
* np = 25: O.O.B. (dark gray)
* **nfr = 5:**
* np = 1: 0.79 (brown)
* np = 2: 0.91 (orange)
* np = 5: 1.09 (light green)
* np = 10: O.O.B. (dark gray)
* np = 25: O.O.B. (dark gray)
* **nfr = 3:**
* np = 1: 0.81 (brown)
* np = 2: 0.91 (orange)
* np = 5: 1.08 (light green)
* np = 10: O.O.B. (dark gray)
* np = 25: O.O.B. (dark gray)
* **nfr = 1:**
* np = 1: 0.87 (brown)
* np = 2: 0.93 (orange)
* np = 5: 1.05 (yellow-green)
* np = 10: 1.13 (light blue-green)
* np = 25: O.O.B. (dark gray)
### Key Observations
* Performance generally increases as the number of initial programs (np) increases from 1 to 5, for a given number of feedback repairs (nfr).
* For np values of 10 and 25, the performance is consistently "O.O.B." (Out of Bounds), except for nfr=1 and np=10, which has a value of 1.13.
* The highest performance value (1.13) is observed when nfr = 1 and np = 10.
* The lowest performance values (0.78, 0.79, 0.81, 0.87) are observed when np = 1.
### Interpretation
The heatmap suggests that increasing the number of initial programs (np) initially improves performance, but beyond a certain point (np = 5 or 10), the system may become "Out of Bounds" (O.O.B.) or performance may plateau. The number of feedback repairs (nfr) also plays a role, with lower nfr values sometimes leading to better performance when combined with a moderate number of initial programs. The "O.O.B." values indicate that the system may not be stable or may not produce meaningful results under those conditions. Further investigation is needed to understand the meaning of "O.O.B." and the factors that cause it.