## Heatmap: Feedback-Repairs vs. Initial Programs
### Overview
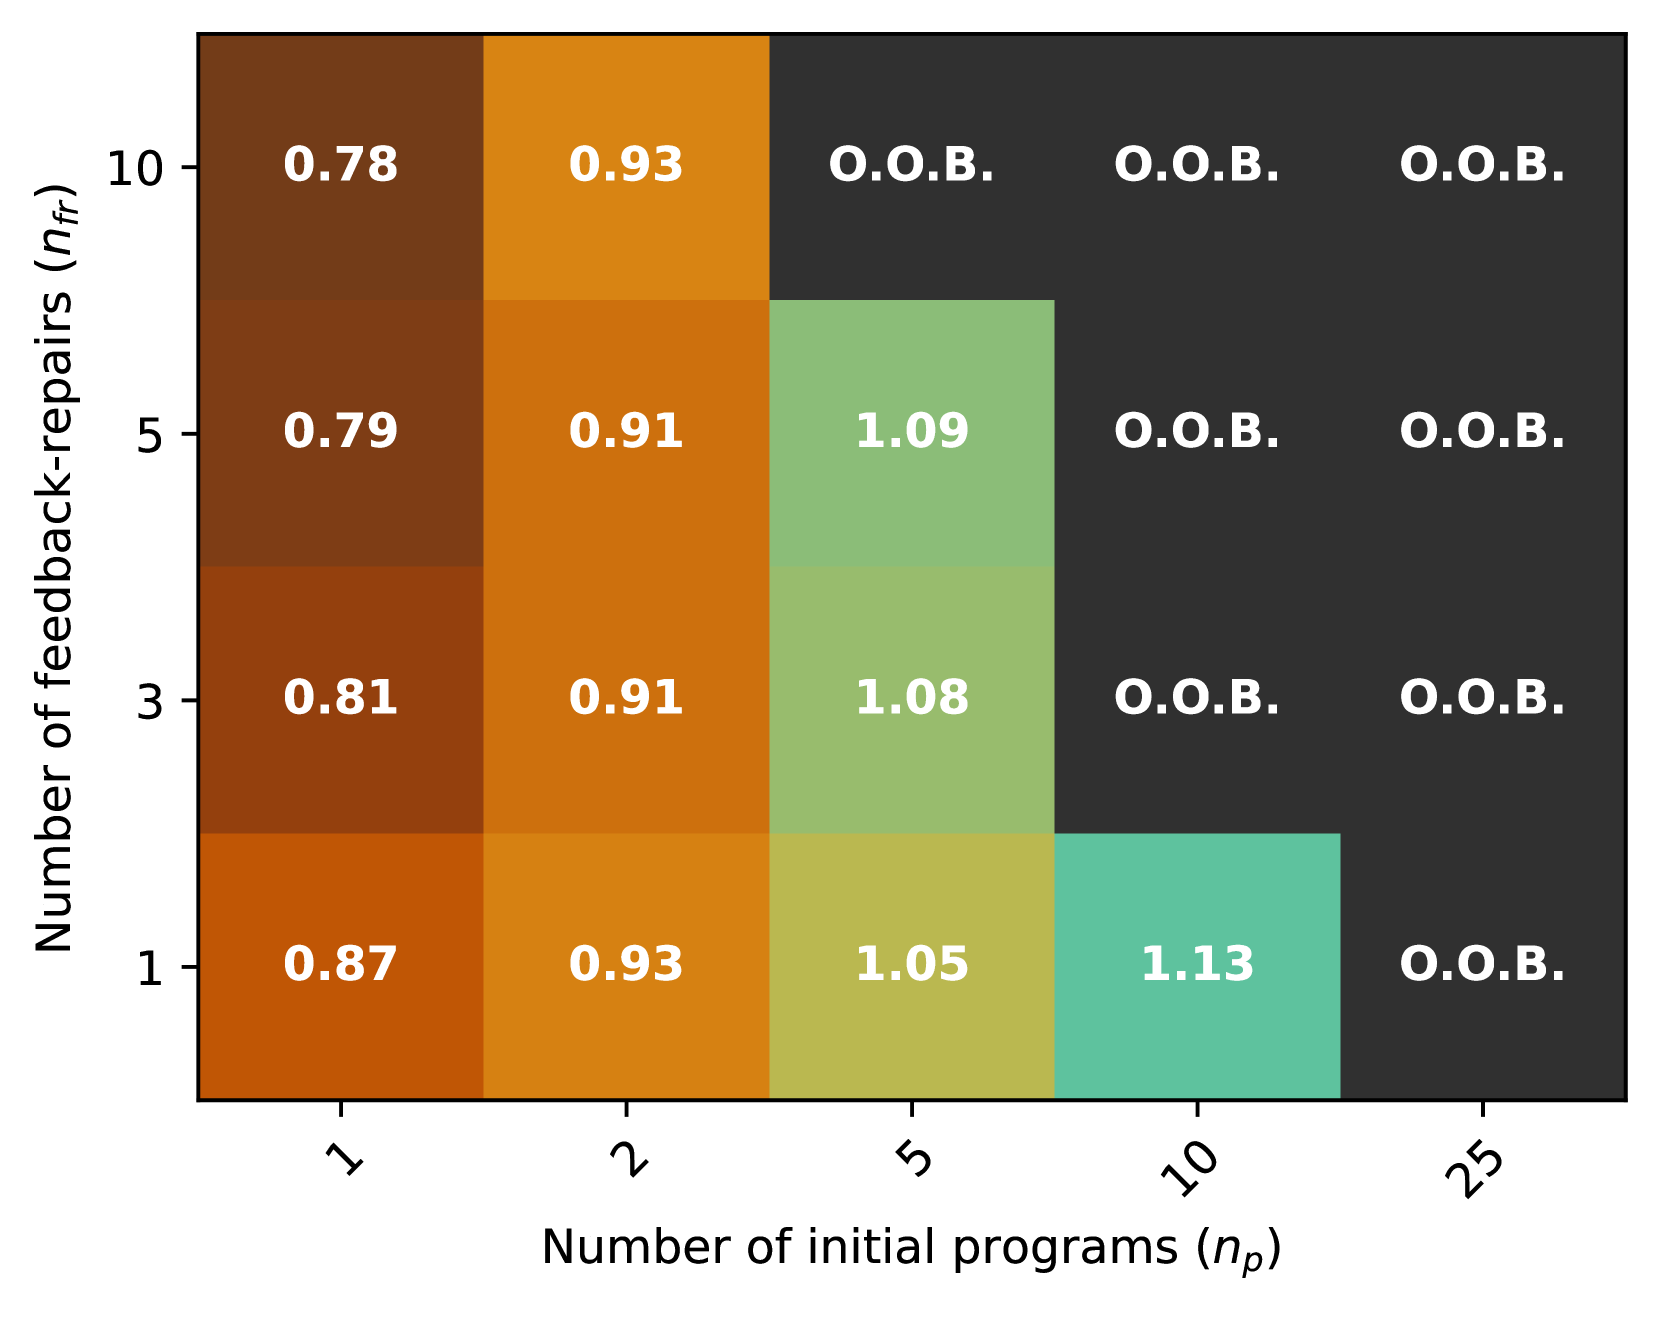
This image presents a heatmap visualizing the relationship between the number of feedback-repairs (n<sub>#</sub>) and the number of initial programs (n<sub>p</sub>). The heatmap uses a color gradient to represent numerical values, with darker colors indicating lower values and lighter colors indicating higher values. Several cells contain the abbreviation "O.O.B." which likely stands for "Out Of Bounds".
### Components/Axes
* **X-axis:** Number of initial programs (n<sub>p</sub>) with markers at 1, 2, 5, 10, and 25.
* **Y-axis:** Number of feedback-repairs (n<sub>#</sub>) with markers at 1, 3, 5, and 10.
* **Color Scale:** A gradient from dark brown to light green, representing the numerical values.
* **Data Labels:** Numerical values are displayed within each cell of the heatmap.
### Detailed Analysis
The heatmap displays the following data points:
* **n<sub>#</sub> = 1, n<sub>p</sub> = 1:** 0.87
* **n<sub>#</sub> = 1, n<sub>p</sub> = 2:** 0.93
* **n<sub>#</sub> = 1, n<sub>p</sub> = 5:** 1.05
* **n<sub>#</sub> = 1, n<sub>p</sub> = 10:** 1.13
* **n<sub>#</sub> = 1, n<sub>p</sub> = 25:** O.O.B.
* **n<sub>#</sub> = 3, n<sub>p</sub> = 1:** 0.81
* **n<sub>#</sub> = 3, n<sub>p</sub> = 2:** 0.91
* **n<sub>#</sub> = 3, n<sub>p</sub> = 5:** 1.08
* **n<sub>#</sub> = 3, n<sub>p</sub> = 10:** O.O.B.
* **n<sub>#</sub> = 3, n<sub>p</sub> = 25:** O.O.B.
* **n<sub>#</sub> = 5, n<sub>p</sub> = 1:** 0.79
* **n<sub>#</sub> = 5, n<sub>p</sub> = 2:** 0.91
* **n<sub>#</sub> = 5, n<sub>p</sub> = 5:** 1.09
* **n<sub>#</sub> = 5, n<sub>p</sub> = 10:** O.O.B.
* **n<sub>#</sub> = 5, n<sub>p</sub> = 25:** O.O.B.
* **n<sub>#</sub> = 10, n<sub>p</sub> = 1:** 0.78
* **n<sub>#</sub> = 10, n<sub>p</sub> = 2:** 0.93
* **n<sub>#</sub> = 10, n<sub>p</sub> = 5:** O.O.B.
* **n<sub>#</sub> = 10, n<sub>p</sub> = 10:** O.O.B.
* **n<sub>#</sub> = 10, n<sub>p</sub> = 25:** O.O.B.
The values generally increase as both the number of initial programs and the number of feedback-repairs increase, but this trend is not consistent across all values. The "O.O.B." values indicate that the corresponding data points are outside the bounds of the measured or defined range.
### Key Observations
* The values are generally clustered between 0.78 and 1.13.
* The highest value observed is 1.13, occurring when n<sub>#</sub> = 1 and n<sub>p</sub> = 10.
* A significant portion of the heatmap is filled with "O.O.B." values, particularly as either n<sub>#</sub> or n<sub>p</sub> increases. This suggests a limitation in the experimental setup or the validity of the model for larger values.
* The values appear to increase with increasing n<sub>p</sub> for a fixed n<sub>#</sub>, up to a point, after which they become "O.O.B.".
### Interpretation
This heatmap likely represents the results of an experiment or simulation investigating the impact of feedback-repairs on the performance of a system with varying numbers of initial programs. The numerical values could represent a metric such as efficiency, accuracy, or success rate.
The increasing trend suggests that, up to a certain point, more feedback-repairs and more initial programs can improve performance. However, the "O.O.B." values indicate that beyond a certain threshold, the system may become unstable or the metric becomes undefined. This could be due to factors such as diminishing returns, increased complexity, or limitations in the experimental setup.
The "O.O.B." values are a critical finding, suggesting that there are practical limits to the benefits of increasing both the number of initial programs and the number of feedback-repairs. Further investigation would be needed to understand the underlying reasons for these limitations and to identify optimal values for n<sub>#</sub> and n<sub>p</sub>. The data suggests a non-linear relationship between the two variables, with a potential saturation point or even a decline in performance beyond a certain level.