## Heatmap: Performance Metric vs. Initial Programs and Feedback-Repairs
### Overview
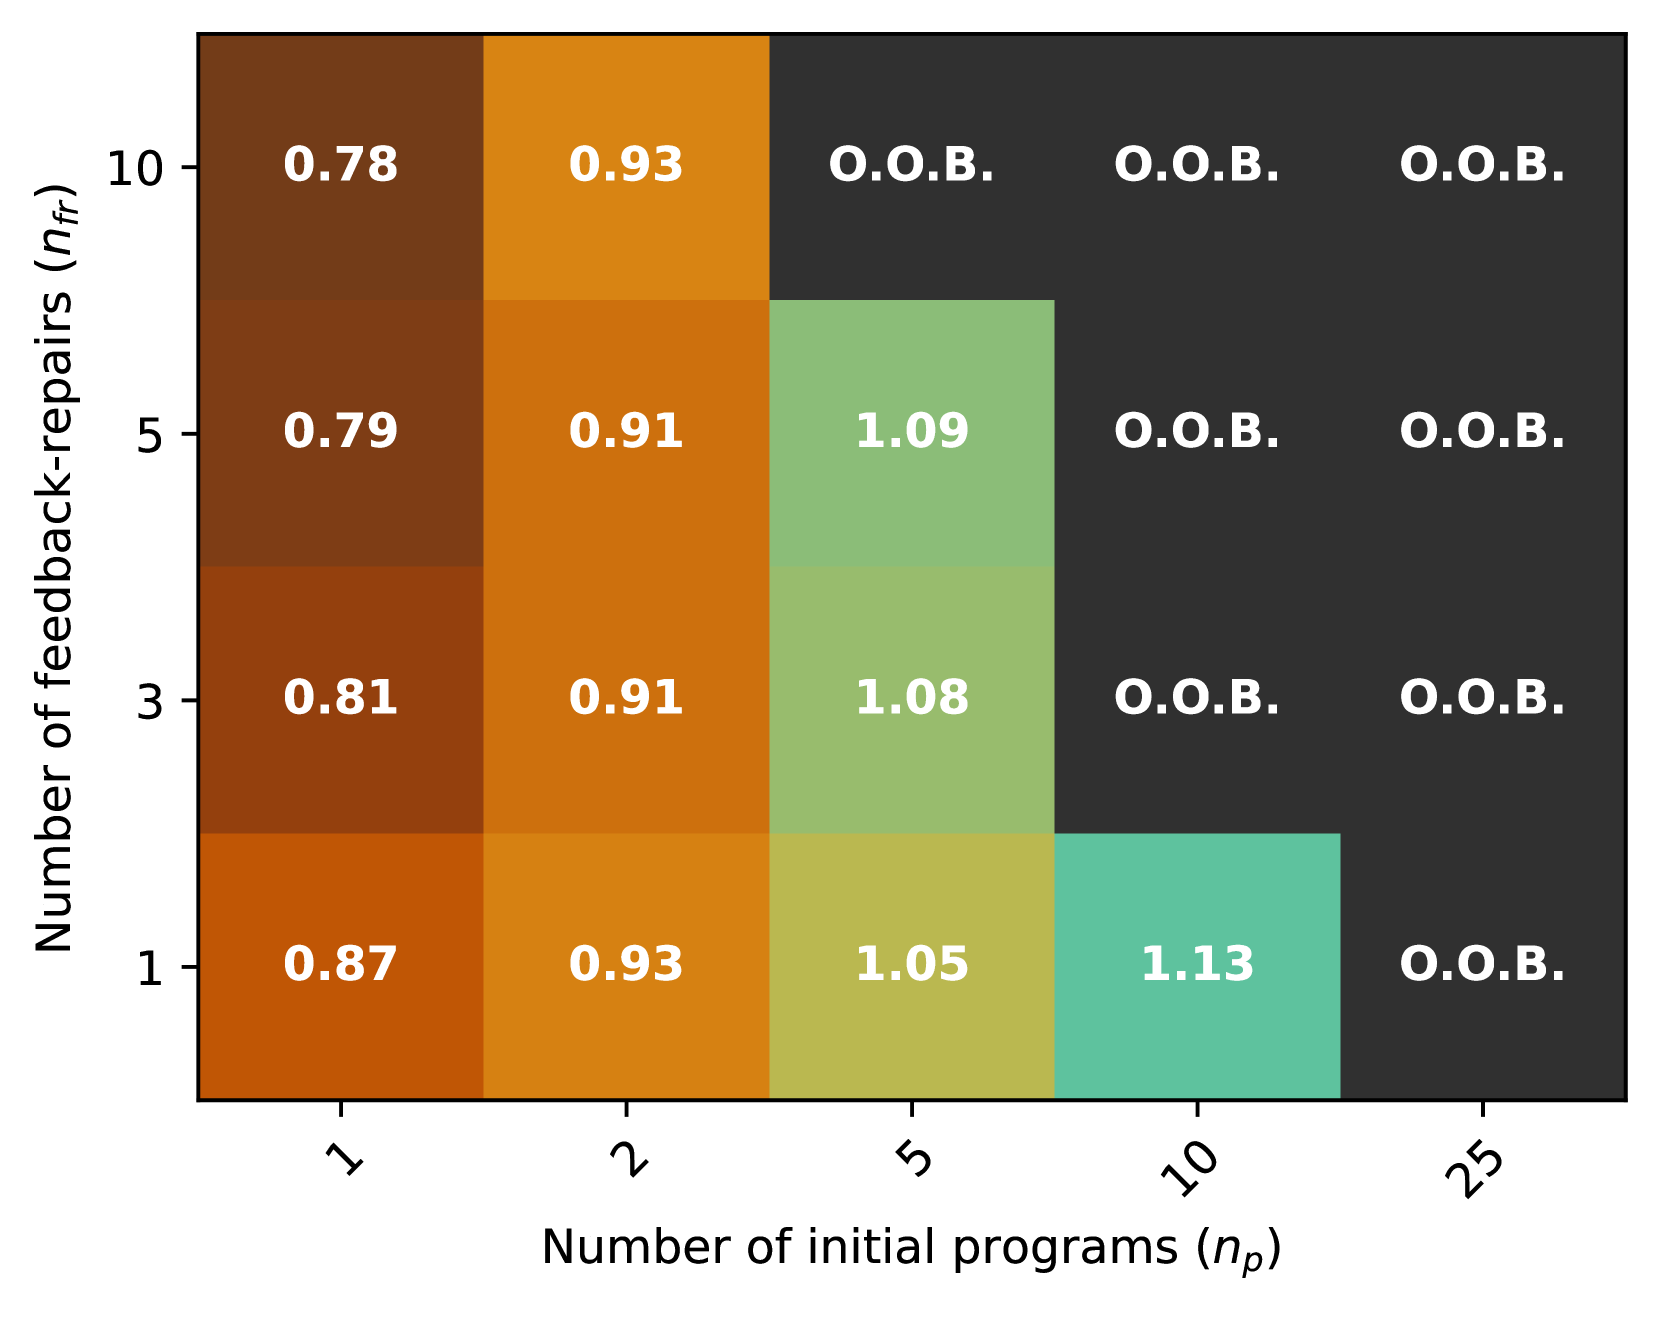
The image is a heatmap chart displaying a performance metric (unlabeled, but likely a score or ratio) as a function of two variables: the "Number of initial programs (n_p)" on the x-axis and the "Number of feedback-repairs (n_fr)" on the y-axis. The chart uses a color gradient to represent the metric's value, with specific numerical values or the label "O.O.B." (likely "Out of Bounds" or "Out of Budget") printed in each cell.
### Components/Axes
* **X-Axis (Horizontal):** Labeled "Number of initial programs (n_p)". The axis markers are categorical, not linear, with the following values from left to right: `1`, `2`, `5`, `10`, `25`.
* **Y-Axis (Vertical):** Labeled "Number of feedback-repairs (n_fr)". The axis markers are also categorical, with the following values from bottom to top: `1`, `3`, `5`, `10`.
* **Data Grid:** A 4-row by 5-column grid. Each cell's background color corresponds to its value, following a gradient from dark brown (lowest values) through orange and yellow-green to teal (highest values). Cells labeled "O.O.B." have a dark gray background.
* **Legend/Color Scale:** There is no explicit legend provided. The color-to-value mapping must be inferred from the data within the cells. The gradient suggests:
* Dark Brown: ~0.78 - 0.87
* Orange: ~0.91 - 0.93
* Yellow-Green: ~1.05 - 1.09
* Teal: ~1.13
* Dark Gray: "O.O.B."
### Detailed Analysis
The following table reconstructs the data from the heatmap. The spatial position is described as (Column, Row), where Column 1 is the leftmost (n_p=1) and Row 1 is the bottommost (n_fr=1).
| n_p (Column) / n_fr (Row) | 1 (Bottom) | 3 | 5 | 10 (Top) |
| :--- | :--- | :--- | :--- | :--- |
| **1 (Left)** | 0.87 | 0.81 | 0.79 | 0.78 |
| **2** | 0.93 | 0.91 | 0.91 | 0.93 |
| **5** | 1.05 | 1.08 | 1.09 | O.O.B. |
| **10** | 1.13 | O.O.B. | O.O.B. | O.O.B. |
| **25 (Right)** | O.O.B. | O.O.B. | O.O.B. | O.O.B. |
**Trend Verification:**
* **Column 1 (n_p=1):** The line of values slopes slightly downward as n_fr increases (0.87 -> 0.81 -> 0.79 -> 0.78).
* **Column 2 (n_p=2):** The values are relatively stable, with a slight dip in the middle (0.93 -> 0.91 -> 0.91 -> 0.93).
* **Column 3 (n_p=5):** The values slope upward as n_fr increases from 1 to 5 (1.05 -> 1.08 -> 1.09), then the result becomes O.O.B. at n_fr=10.
* **Column 4 (n_p=10):** Only the bottom cell (n_fr=1) has a value (1.13). All cells above it are O.O.B.
* **Column 5 (n_p=25):** All cells are O.O.B., regardless of n_fr.
### Key Observations
1. **Performance Peak:** The highest recorded metric value is **1.13**, found at the combination of n_p=10 and n_fr=1 (bottom-right of the populated area).
2. **"O.O.B." Boundary:** A clear boundary exists where results become "O.O.B.". This boundary moves leftward (towards lower n_p) as n_fr increases.
* At n_fr=1, O.O.B. starts at n_p=25.
* At n_fr=3 & 5, O.O.B. starts at n_p=10.
* At n_fr=10, O.O.B. starts at n_p=5.
3. **Inverse Relationship at Low n_p:** For the smallest number of initial programs (n_p=1), increasing feedback-repairs (n_fr) leads to a slight *decrease* in the metric.
4. **Optimal Zone:** The "sweet spot" for achieving a high metric (>1.0) appears to be with a moderate number of initial programs (n_p=5 or 10) combined with a low number of feedback-repairs (n_fr=1 or 3).
### Interpretation
This heatmap likely illustrates the results of an experiment or simulation in fields like automated program repair, machine learning model tuning, or iterative software development. The metric could represent a success rate, efficiency score, or quality improvement ratio.
The data suggests a **trade-off between initial exploration (n_p) and iterative refinement (n_fr)**. Simply increasing both parameters does not guarantee better results and quickly leads to an "Out of Bounds" condition, which could signify computational cost, time limits, or diminishing returns.
The most effective strategy indicated by this data is to start with a moderate pool of initial candidates (5-10 programs) and apply a limited, focused number of repair iterations (1-3). Starting with too few initial programs (n_p=1) limits the ceiling for improvement, while starting with too many (n_p=25) or applying too many repairs (high n_fr) is inefficient or infeasible. The slight performance dip at n_p=1 as repairs increase might indicate overfitting or wasted effort on a poor initial candidate.