## Heatmap: Relationship Between Feedback-Repairs and Initial Programs
### Overview
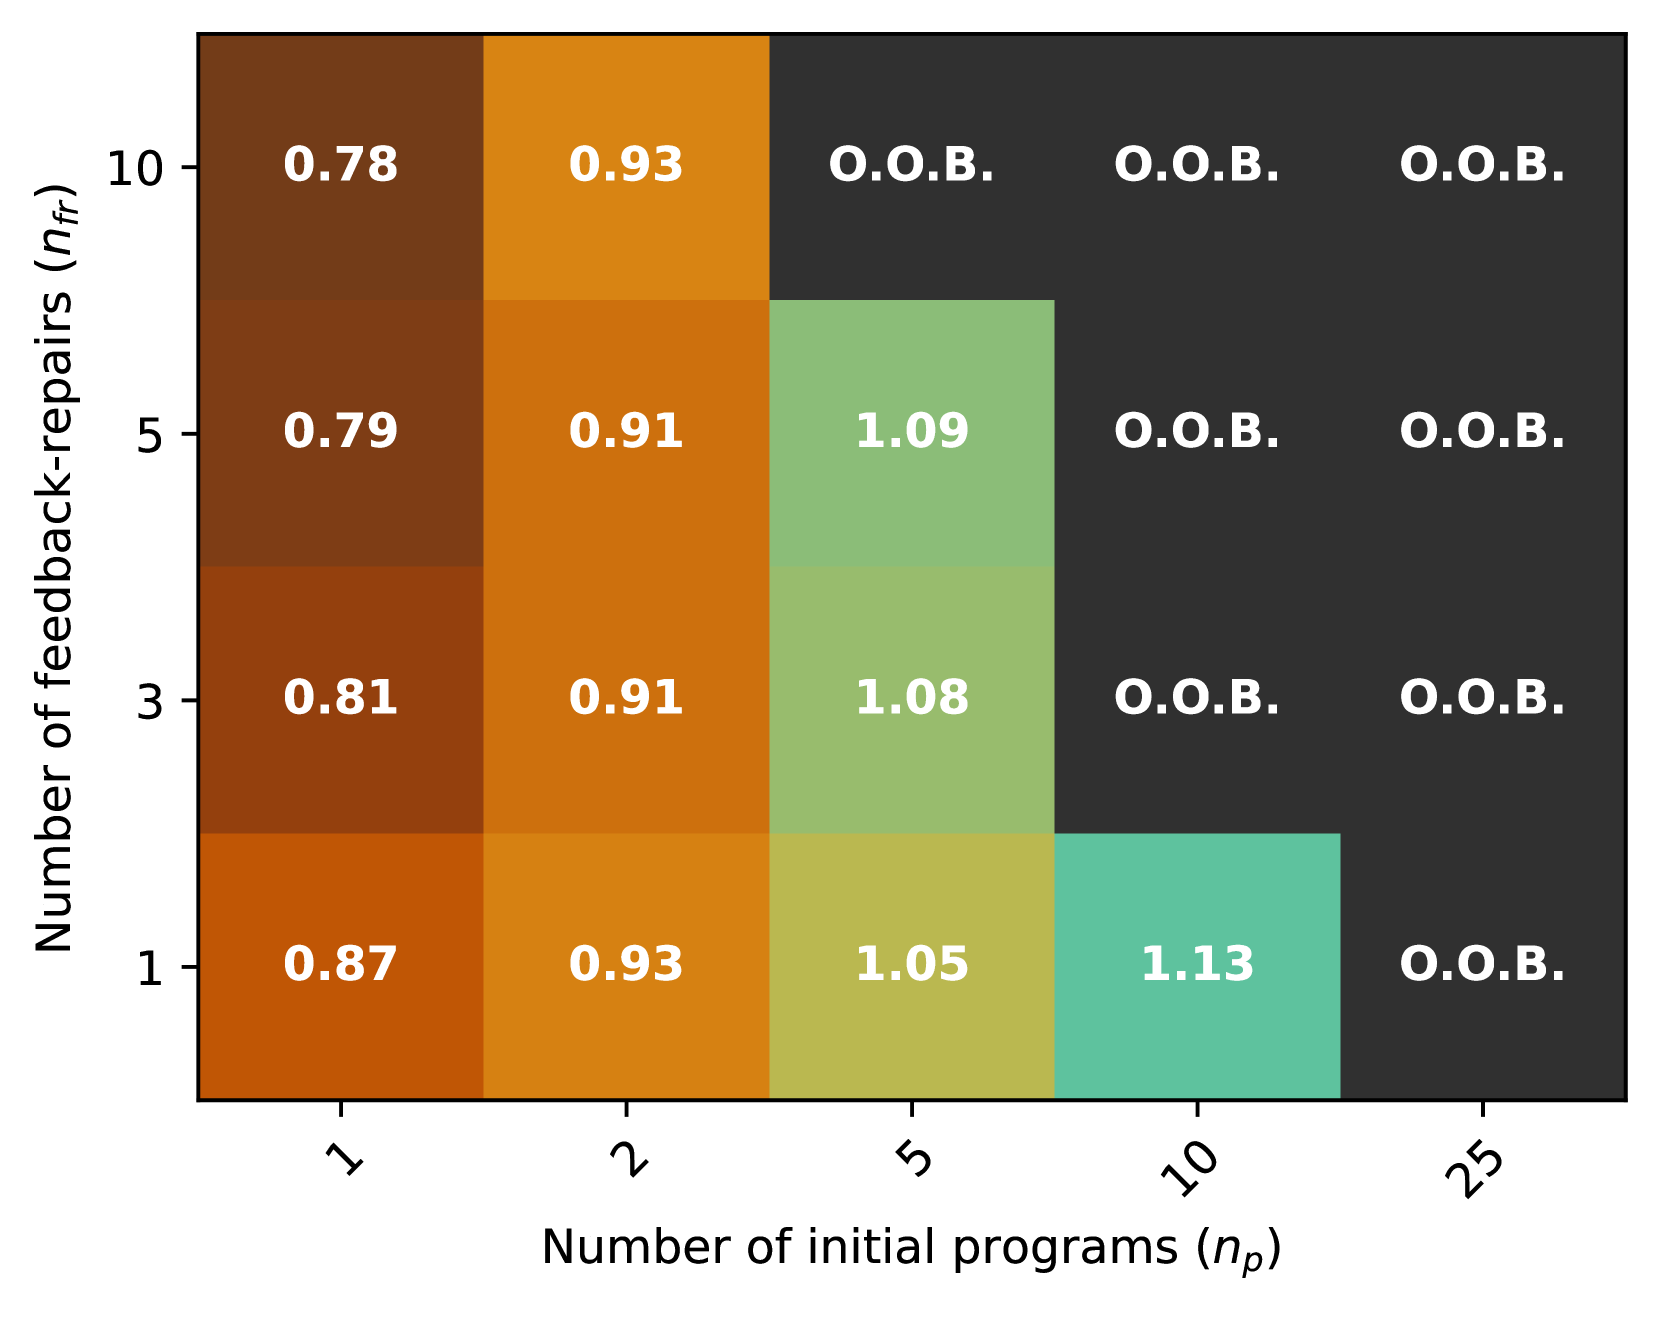
The image is a heatmap visualizing the relationship between the number of feedback-repairs (`n_fr`) and the number of initial programs (`n_p`). Values are represented numerically in grid cells, with color gradients (brown to green to black) indicating magnitude. Some cells contain "O.O.B." (likely "Out of Bounds" or "Not Applicable").
### Components/Axes
- **Y-axis (Vertical)**: "Number of feedback-repairs (`n_fr`)" with values: 1, 3, 5, 10.
- **X-axis (Horizontal)**: "Number of initial programs (`n_p`)" with values: 1, 2, 5, 10, 25.
- **Grid Cells**: Numerical values (e.g., 0.78, 0.93, 1.09) and "O.O.B." markers.
- **Color Gradient**:
- Brown (low values, ~0.78–0.93)
- Green (mid values, ~1.05–1.13)
- Black (high values or "O.O.B.").
### Detailed Analysis
#### Grid Values
| `n_p` \ `n_fr` | 1 | 2 | 5 | 10 | 25 |
|----------------|---------|---------|---------|---------|---------|
| **1** | 0.87 | 0.93 | 1.05 | 1.13 | O.O.B. |
| **3** | 0.81 | 0.91 | 1.08 | O.O.B. | O.O.B. |
| **5** | 0.79 | 0.91 | 1.09 | O.O.B. | O.O.B. |
| **10** | 0.78 | 0.93 | O.O.B. | O.O.B. | O.O.B. |
#### Key Observations
1. **Trend**:
- Values increase with higher `n_p` and `n_fr` until reaching "O.O.B.".
- For `n_p = 1`, values rise from 0.87 (at `n_fr = 1`) to 1.13 (at `n_fr = 10`).
- For `n_p = 2`, values peak at 0.93 (consistent across `n_fr = 1` and `n_fr = 10`).
- "O.O.B." dominates for larger `n_p` (e.g., `n_p = 25` is entirely "O.O.B.").
2. **Anomalies**:
- `n_p = 10` and `n_fr = 1` has the highest valid value (1.13).
- `n_p = 5` and `n_fr = 10` is "O.O.B.", while `n_p = 5` and `n_fr = 5` is 1.09.
### Interpretation
The heatmap suggests a nonlinear relationship between initial programs and feedback-repairs. Lower `n_p` values (1–5) show gradual increases in feedback-repair efficiency (values 0.78–1.13), but beyond `n_p = 10`, results become invalid ("O.O.B."). This implies diminishing returns or system instability at higher program counts. The "O.O.B." markers likely indicate thresholds where the system cannot handle additional feedback-repairs or programs. The color gradient reinforces this, with black cells signaling critical limits.