## Line Chart: MER Average vs N
### Overview
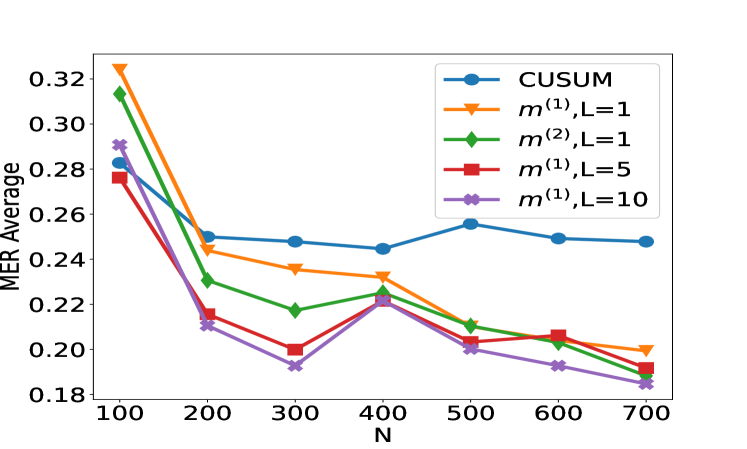
The image is a line chart comparing the MER (Match Error Rate) Average for different methods (CUSUM and m) with varying parameters (L) as a function of N. The chart displays five different data series, each represented by a distinct color and marker. The x-axis represents N, and the y-axis represents the MER Average.
### Components/Axes
* **Title:** There is no explicit title on the chart.
* **X-axis:**
* Label: "N"
* Scale: 100 to 700, with markers at 100, 200, 300, 400, 500, 600, and 700.
* **Y-axis:**
* Label: "MER Average"
* Scale: 0.18 to 0.32, with markers at 0.18, 0.20, 0.22, 0.24, 0.26, 0.28, 0.30, and 0.32.
* **Legend:** Located in the top-right corner of the chart.
* Blue: CUSUM
* Orange: m^(1), L=1
* Green: m^(2), L=1
* Red: m^(1), L=5
* Purple: m^(1), L=10
### Detailed Analysis
* **CUSUM (Blue, circle marker):** The line starts at approximately 0.29 at N=100, decreases to around 0.25 at N=200, remains relatively stable around 0.25 until N=500, then slightly increases to approximately 0.26 at N=500, and finally decreases to around 0.25 at N=700.
* **m^(1), L=1 (Orange, triangle marker):** The line starts at approximately 0.32 at N=100, decreases to around 0.25 at N=200, then decreases further to approximately 0.24 at N=300, remains relatively stable around 0.23 until N=500, and finally decreases to around 0.20 at N=700.
* **m^(2), L=1 (Green, diamond marker):** The line starts at approximately 0.31 at N=100, decreases to around 0.24 at N=200, then decreases further to approximately 0.22 at N=300, increases to approximately 0.23 at N=400, and finally decreases to around 0.19 at N=700.
* **m^(1), L=5 (Red, square marker):** The line starts at approximately 0.28 at N=100, decreases to around 0.21 at N=200, then decreases further to approximately 0.20 at N=300, increases to approximately 0.23 at N=400, and finally decreases to around 0.19 at N=700.
* **m^(1), L=10 (Purple, x marker):** The line starts at approximately 0.29 at N=100, decreases to around 0.21 at N=200, then decreases further to approximately 0.19 at N=300, increases to approximately 0.23 at N=400, and finally decreases to around 0.18 at N=700.
### Key Observations
* All methods show a decrease in MER Average as N increases from 100 to 200.
* The CUSUM method has the most stable MER Average across the range of N values.
* The m^(1), L=10 method generally has the lowest MER Average for N greater than 300.
* The m^(1), L=5 and m^(1), L=10 methods exhibit a similar trend, with a slight increase in MER Average around N=400.
### Interpretation
The chart compares the performance of different methods for reducing the Match Error Rate (MER) as the parameter N changes. The CUSUM method appears to be more stable, while the m methods, particularly m^(1) with L=10, tend to achieve lower MER averages at higher N values. The slight increase in MER Average for m^(1) methods around N=400 might indicate a specific characteristic or limitation of these methods in that range. Overall, the data suggests that the choice of method and parameters (L) can significantly impact the MER Average, and the optimal choice may depend on the specific value of N.