# Technical Document Analysis of Chart
## 1. Labels, Axis Titles, Legends, and Axis Markers
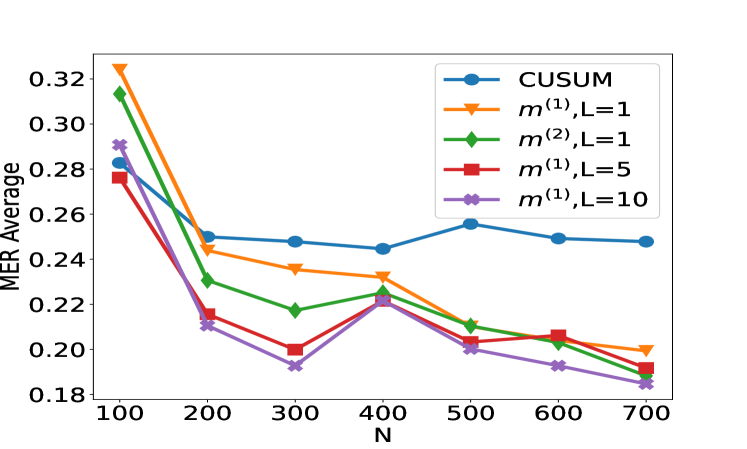
- **X-Axis Label**: `N` (ranging from 100 to 700 in increments of 100).
- **Y-Axis Label**: `MER Average` (ranging from 0.18 to 0.32 in increments of 0.02).
- **Legend Entries**:
- `CUSUM` (blue circles).
- `m^(1),L=1` (orange triangles).
- `m^(2),L=1` (green diamonds).
- `m^(1),L=5` (red squares).
- `m^(1),L=10` (purple crosses).
## 2. Categories and Sub-Categories
- **Categories**:
- `CUSUM`
- `m^(1),L=1`
- `m^(2),L=1`
- `m^(1),L=5`
- `m^(1),L=10`
- **Sub-Categories**:
- For `m^(1)` and `m^(2)` methods, `L` values (1, 5, 10) represent different model configurations.
## 3. Text Embedded in Diagram
- **Legend Text**:
- `CUSUM` (blue circle).
- `m^(1),L=1` (orange triangle).
- `m^(2),L=1` (green diamond).
- `m^(1),L=5` (red square).
- `m^(1),L=10` (purple cross).
## 4. Data Table (Not Applicable)
- No data table is present in the image.
## 5. Legend Color/Label Cross-Reference
- **Blue Circles**: Confirmed as `CUSUM`.
- **Orange Triangles**: Confirmed as `m^(1),L=1`.
- **Green Diamonds**: Confirmed as `m^(2),L=1`.
- **Red Squares**: Confirmed as `m^(1),L=5`.
- **Purple Crosses**: Confirmed as `m^(1),L=10`.
## 6. Spatial Grounding of Legend
- **Legend Placement**: Top-right corner of the chart.
## 7. Trend Verification and Data Points
### CUSUM (Blue Circles)
- **Trend**: Starts at ~0.28 (N=100), dips slightly, then remains relatively flat with minor fluctuations. Ends at ~0.245 (N=700).
- **Data Points**:
- N=100: 0.28
- N=200: 0.25
- N=300: 0.248
- N=400: 0.245
- N=500: 0.255
- N=600: 0.248
- N=700: 0.245
### m^(1),L=1 (Orange Triangles)
- **Trend**: Starts at ~0.325 (N=100), drops sharply to ~0.24 (N=200), then gradually decreases to ~0.20 (N=700).
- **Data Points**:
- N=100: 0.325
- N=200: 0.24
- N=300: 0.235
- N=400: 0.23
- N=500: 0.215
- N=600: 0.205
- N=700: 0.20
### m^(2),L=1 (Green Diamonds)
- **Trend**: Starts at ~0.315 (N=100), drops to ~0.23 (N=200), fluctuates slightly, then trends downward to ~0.19 (N=700).
- **Data Points**:
- N=100: 0.315
- N=200: 0.23
- N=300: 0.22
- N=400: 0.225
- N=500: 0.21
- N=600: 0.205
- N=700: 0.19
### m^(1),L=5 (Red Squares)
- **Trend**: Starts at ~0.275 (N=100), drops to ~0.21 (N=200), fluctuates, then trends downward to ~0.195 (N=700).
- **Data Points**:
- N=100: 0.275
- N=200: 0.21
- N=300: 0.205
- N=400: 0.215
- N=500: 0.205
- N=600: 0.205
- N=700: 0.195
### m^(1),L=10 (Purple Crosses)
- **Trend**: Starts at ~0.29 (N=100), drops to ~0.21 (N=200), fluctuates, then trends downward to ~0.185 (N=700).
- **Data Points**:
- N=100: 0.29
- N=200: 0.21
- N=300: 0.195
- N=400: 0.215
- N=500: 0.205
- N=600: 0.195
- N=700: 0.185
## 8. Component Isolation
- **Header**: Chart title (not explicitly labeled but implied by context).
- **Main Chart**: Plot area with axes, data lines, and markers.
- **Footer**: Legend box in the top-right corner.
## 9. Key Observations
- **CUSUM** maintains the most stable MER Average across all N values.
- **m^(1),L=1** and **m^(2),L=1** show significant declines as N increases, with `m^(1),L=1` starting higher but declining more sharply.
- **m^(1),L=5** and **m^(1),L=10** exhibit similar trends but with less pronounced declines compared to `m^(1),L=1`.
## 10. Conclusion
The chart illustrates the performance of different statistical methods (CUSUM, m^(1),L=1, m^(2),L=1, m^(1),L=5, m^(1),L=10) in terms of MER Average as a function of sample size (N). CUSUM demonstrates the most consistent performance, while methods with higher `L` values (e.g., L=5, L=10) show improved stability at larger N.