## Bar Chart: Unfaithfulness Retention After Oversampling
### Overview
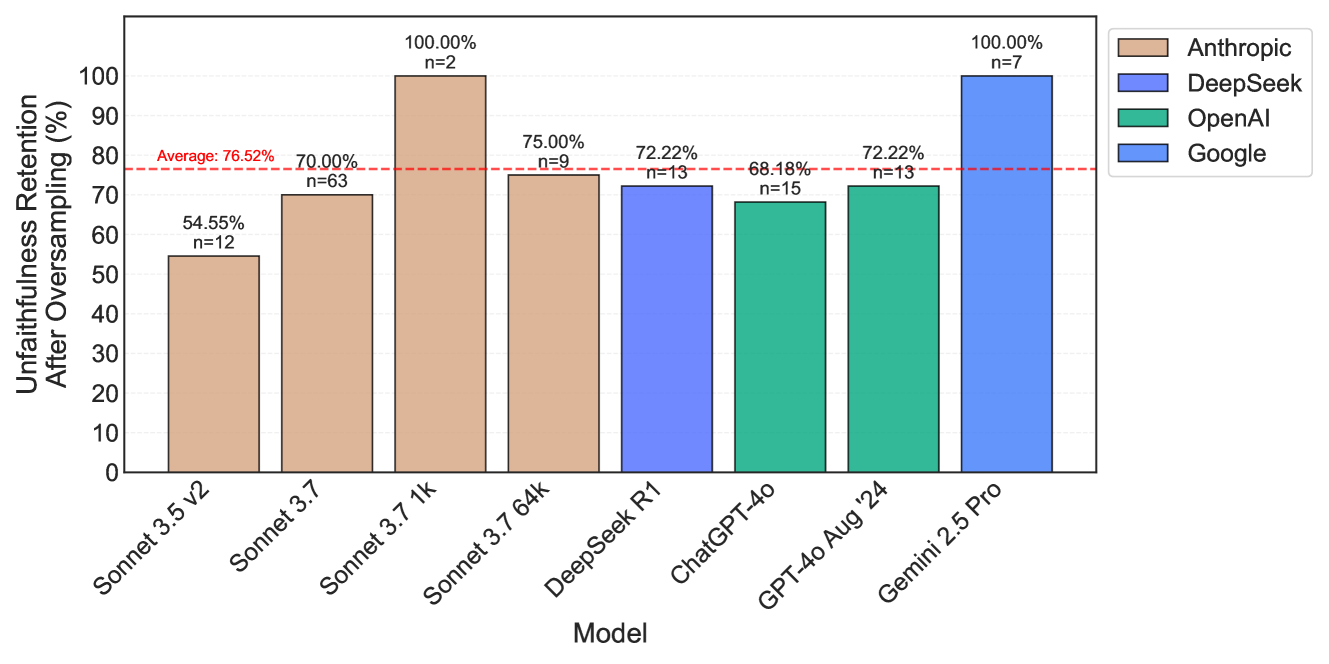
The image is a bar chart comparing the unfaithfulness retention after oversampling for different language models. The y-axis represents the percentage of unfaithfulness retention, and the x-axis represents the model names. The chart includes data for models from Anthropic, DeepSeek, OpenAI, and Google. A horizontal dashed red line indicates the average unfaithfulness retention across all models.
### Components/Axes
* **Title:** Unfaithfulness Retention After Oversampling (%)
* **X-axis:** Model
* Models listed: Sonnet 3.5 v2, Sonnet 3.7, Sonnet 3.7 1k, Sonnet 3.7 64k, DeepSeek R1, ChatGPT-4o, GPT-4o Aug '24, Gemini 2.5 Pro
* **Y-axis:** Unfaithfulness Retention After Oversampling (%)
* Scale: 0% to 100% in increments of 10%.
* **Legend:** Located in the top-right corner.
* Anthropic (tan color)
* DeepSeek (light blue color)
* OpenAI (green color)
* Google (blue color)
* **Average Line:** A horizontal dashed red line at approximately 76.52%.
### Detailed Analysis
The chart presents the unfaithfulness retention percentages for each model, grouped by the company that developed them. The value of each bar is written above it, along with the sample size "n=".
* **Anthropic:** (tan bars)
* Sonnet 3.5 v2: 54.55%, n=12
* Sonnet 3.7: 70.00%, n=63
* Sonnet 3.7 1k: 100.00%, n=2
* Sonnet 3.7 64k: 75.00%, n=9
* **DeepSeek:** (light blue bars)
* DeepSeek R1: 72.22%, n=13
* **OpenAI:** (green bars)
* ChatGPT-4o: 68.18%, n=15
* GPT-4o Aug '24: 72.22%, n=13
* **Google:** (blue bars)
* Gemini 2.5 Pro: 100.00%, n=7
### Key Observations
* Anthropic's Sonnet 3.7 1k and Google's Gemini 2.5 Pro both exhibit 100% unfaithfulness retention after oversampling.
* ChatGPT-4o has the lowest unfaithfulness retention among the models listed at 68.18%.
* The average unfaithfulness retention across all models is approximately 76.52%.
### Interpretation
The bar chart illustrates the performance of different language models in terms of unfaithfulness retention after oversampling. The data suggests that certain models, such as Sonnet 3.7 1k and Gemini 2.5 Pro, are more prone to retaining unfaithful information after oversampling compared to others like ChatGPT-4o. The average retention rate provides a benchmark for evaluating the performance of individual models. The sample sizes (n=) indicate the number of data points used to calculate each percentage, which can be used to assess the reliability of the results. The chart highlights the variability in unfaithfulness retention across different models and companies, suggesting that model architecture and training data may play a significant role in this aspect of language model performance.