## Bar Charts with Line Plot: Performance Metrics Across Configurations
### Overview
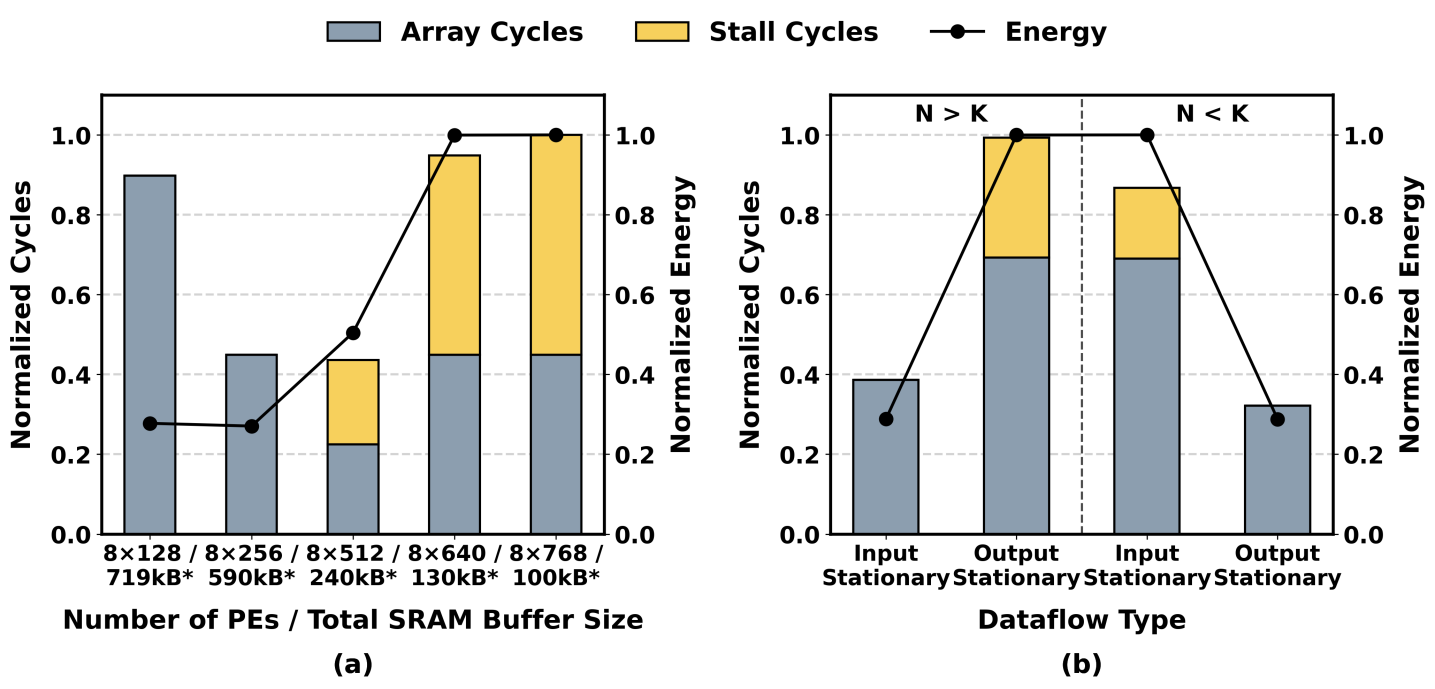
The image contains two bar charts (labeled a and b) with overlaid line plots, comparing normalized cycles and energy metrics across different hardware configurations and dataflow scenarios. The charts use color-coded bars (gray for "Array Cycles," orange for "Stall Cycles") and a black line with markers for "Energy." Both charts emphasize trade-offs between computational efficiency and energy consumption.
---
### Components/Axes
#### Chart (a): PE/Buffer Size vs. Performance
- **X-axis**:
- Categories: "8x128 / 719kB*", "8x256 / 590kB*", "8x512 / 240kB*", "8x640 / 130kB*", "8x768 / 100kB*"
- Labels represent combinations of Processing Elements (PEs) and total SRAM buffer sizes.
- **Y-axis**:
- "Normalized Cycles" (left scale, 0.0–1.0)
- "Normalized Energy" (right scale, 0.0–1.0)
- **Legend**:
- Gray: "Array Cycles"
- Orange: "Stall Cycles"
- Black line with dots: "Energy"
- **Line Plot**:
- Connects energy data points across configurations.
#### Chart (b): Dataflow Type vs. Performance
- **X-axis**:
- Categories: "Input Stationary," "Output Stationary," "Input Stationary," "Output Stationary" (repeated labels suggest a possible error or intentional grouping).
- Vertical dashed line separates "N > K" (left) and "N < K" (right).
- **Y-axis**:
- Same as Chart (a): "Normalized Cycles" and "Normalized Energy."
- **Legend**:
- Same as Chart (a): Gray ("Array Cycles"), Orange ("Stall Cycles"), Black line ("Energy").
---
### Detailed Analysis
#### Chart (a) Trends
1. **Array Cycles (Gray Bars)**:
- Decrease monotonically as PEs/buffer size increases (e.g., 8x128: ~0.9, 8x768: ~0.45).
- Suggests higher parallelism reduces per-cycle workload.
2. **Stall Cycles (Orange Bars)**:
- Increase with larger configurations (e.g., 8x128: ~0.1, 8x768: ~0.55).
- Indicates growing overhead (e.g., memory contention, synchronization).
3. **Energy (Black Line)**:
- Peaks at 8x640 and 8x768 (~0.95), then plateaus.
- Energy efficiency worsens with larger configurations despite lower array cycles.
#### Chart (b) Trends
1. **N > K (Left Side)**:
- **Input Stationary**: Array cycles ~0.7, Stall cycles ~0.3.
- **Output Stationary**: Array cycles ~0.7, Stall cycles ~0.3.
- Energy peaks at ~0.95 for both input/output.
2. **N < K (Right Side)**:
- **Input Stationary**: Array cycles ~0.4, Stall cycles ~0.4.
- **Output Stationary**: Array cycles ~0.4, Stall cycles ~0.4.
- Energy drops to ~0.35, showing improved efficiency.
---
### Key Observations
1. **Trade-off in Chart (a)**:
- Larger PEs/buffer sizes reduce array cycles but increase stall cycles, with energy peaking at mid-to-high configurations.
2. **Dataflow Sensitivity in Chart (b)**:
- "N > K" and "N < K" scenarios show divergent performance:
- **N > K**: Higher array cycles but lower stall cycles (better for compute-bound tasks).
- **N < K**: Balanced array/stall cycles but lower energy (better for memory-bound tasks).
3. **Energy Anomaly**:
- Energy peaks at 8x640/8x768 in Chart (a) despite lower array cycles, suggesting hidden overheads (e.g., memory access latency).
---
### Interpretation
The data highlights a critical tension between computational efficiency and energy consumption:
- **Chart (a)** demonstrates that increasing parallelism (PEs/buffer) improves array cycle efficiency but introduces diminishing returns due to stall cycles and energy spikes. This suggests architectural limits to scaling.
- **Chart (b)** reveals that dataflow type (input/output) and the N/K relationship dictate performance:
- **N > K**: Favors compute-heavy workloads with higher array utilization but risks energy waste.
- **N < K**: Optimizes for memory-bound tasks with balanced cycles and lower energy, ideal for latency-sensitive applications.
- **Practical Implication**: System designers must balance PE count, buffer size, and dataflow patterns to avoid energy inefficiencies while maintaining throughput. The repeated "Input Stationary" labels in Chart (b) may indicate a data labeling error, warranting verification.