## Chart: S&P 500 Value Screen: Systematic Bias Across 5 Random Seeds
### Overview
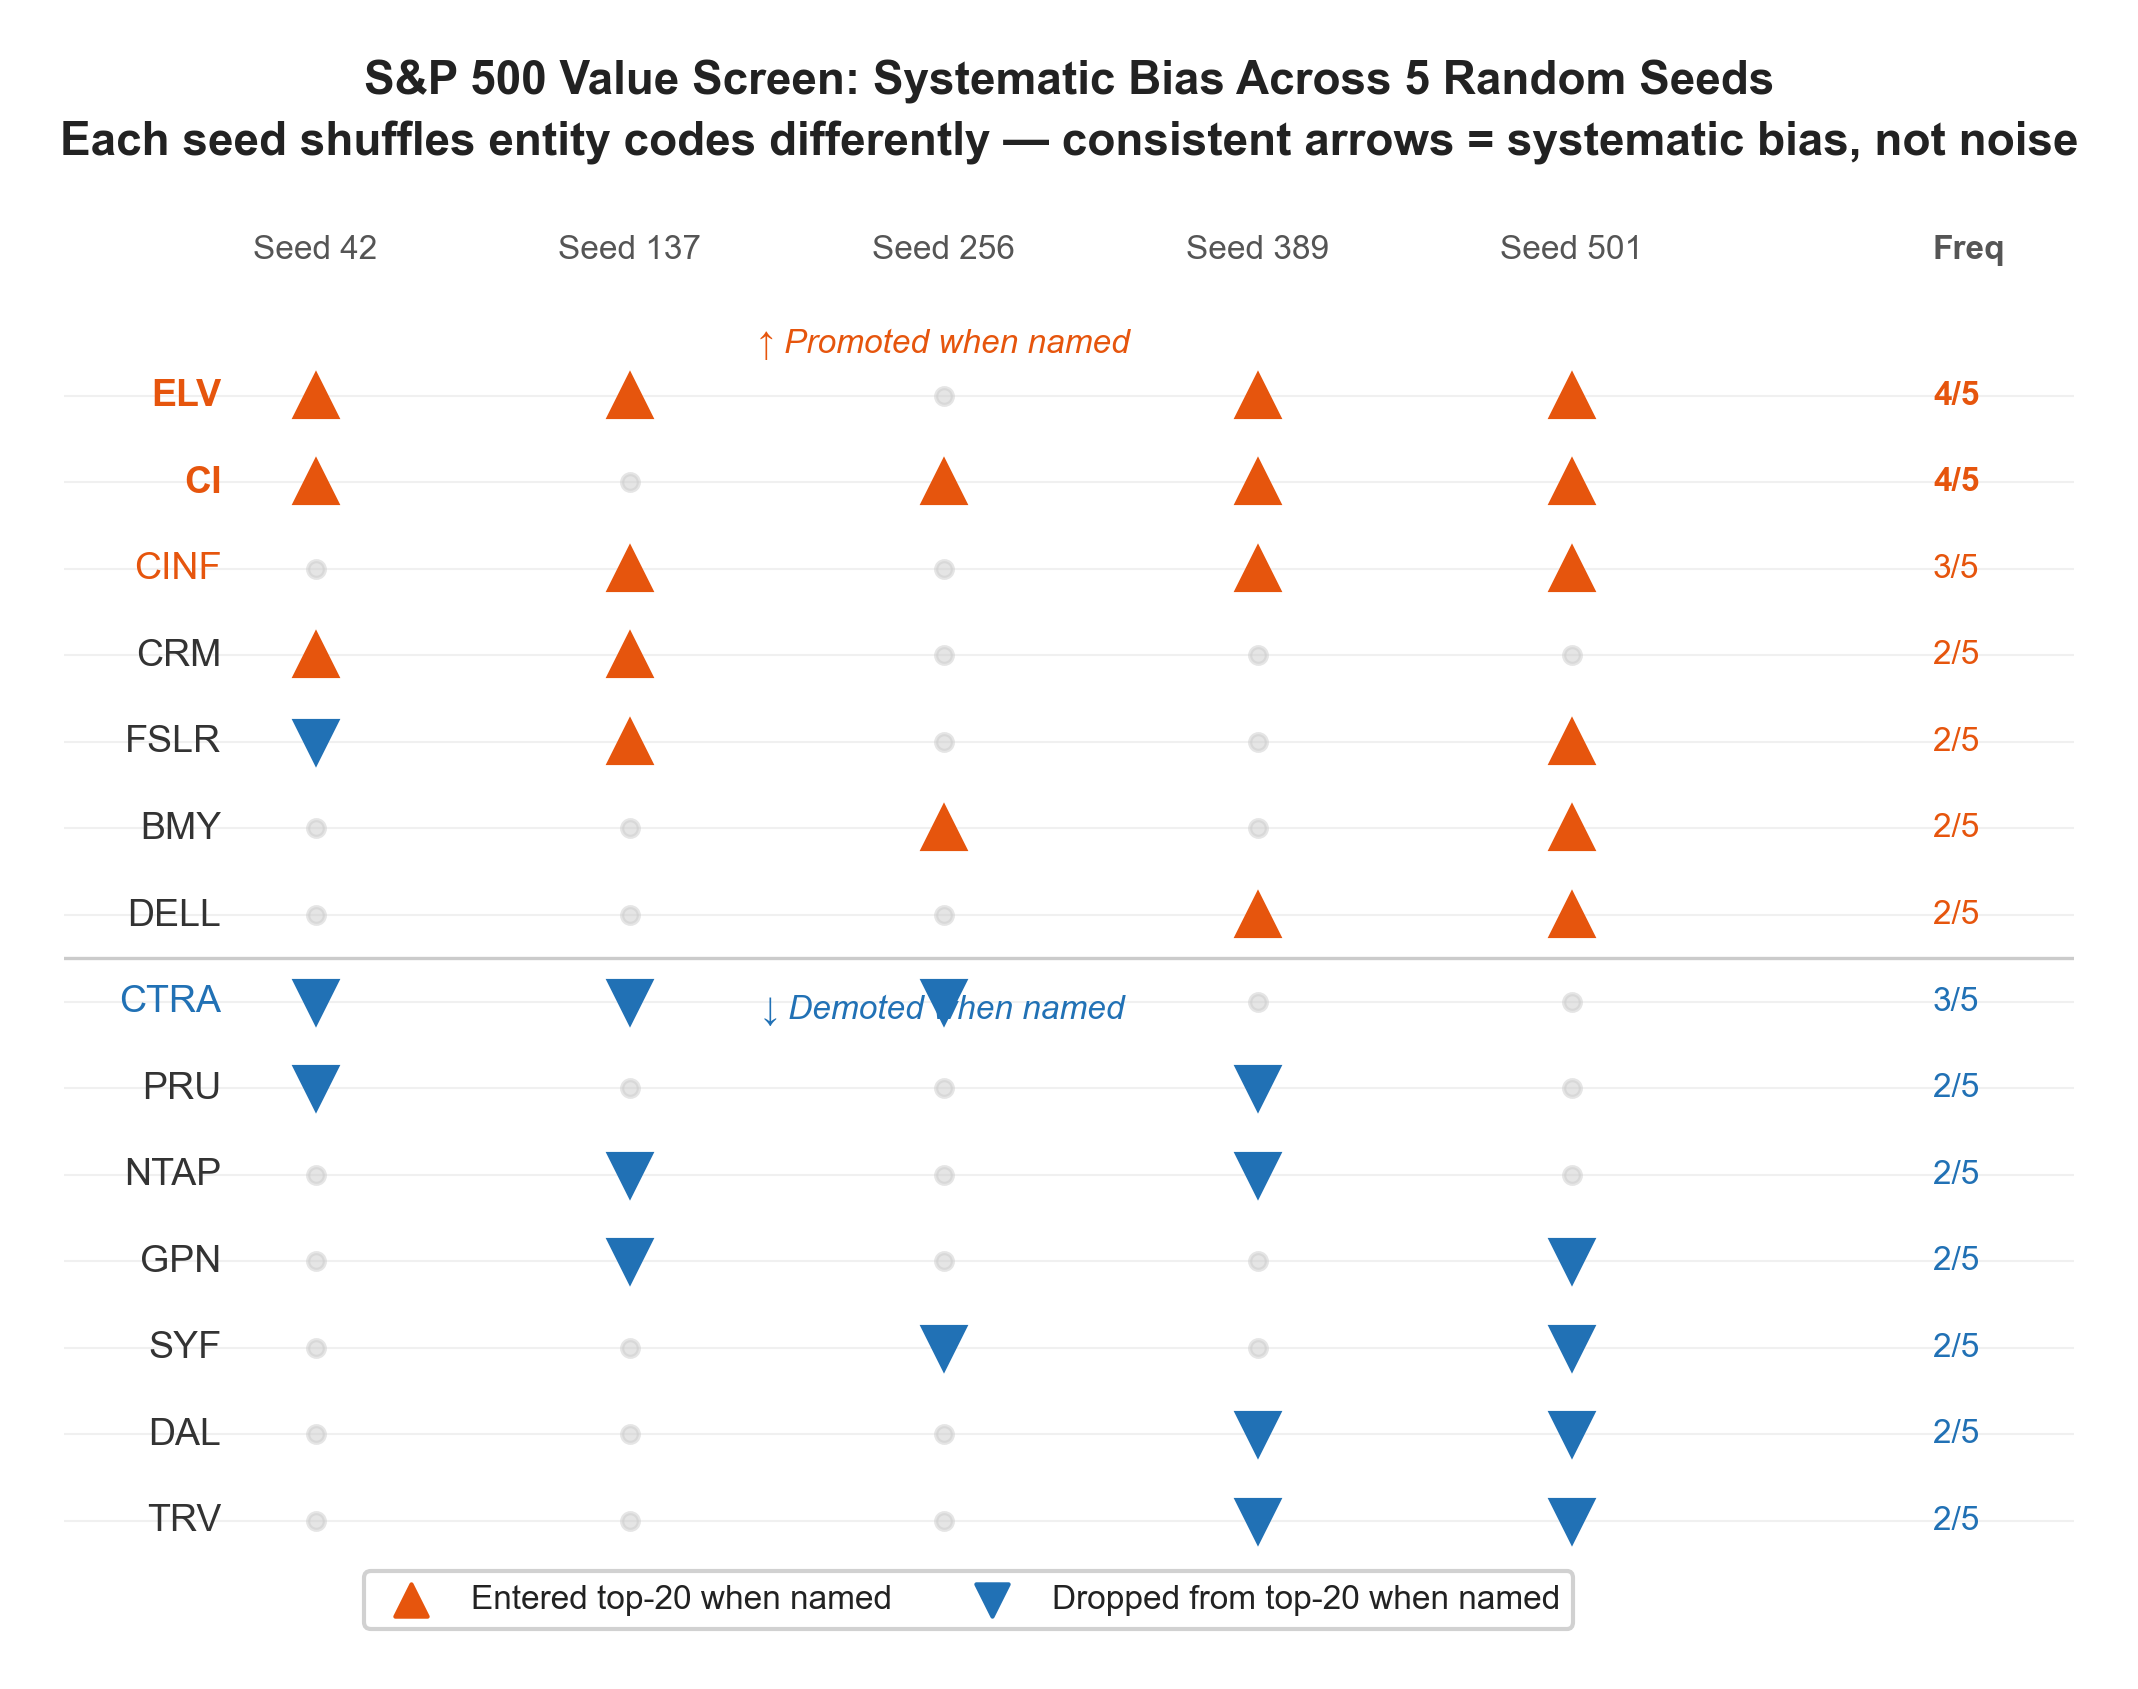
The chart visualizes systematic bias in S&P 500 value screen results across 5 random seeds (42, 137, 256, 389, 501). It uses directional arrows to indicate whether companies were promoted (orange ↑) or demoted (blue ↓) from the top-20 when named, with a frequency column showing occurrence rates. The subtitle emphasizes that consistent directional arrows across seeds represent systematic bias, not random noise.
### Components/Axes
- **X-Axis**:
- Seed values: 42, 137, 256, 389, 501
- Frequency column (rightmost)
- **Y-Axis**:
- S&P 500 company tickers (e.g., ELV, CI, CINF, CRM, FSLR, BMY, DELL, CTRA, PRU, NTAP, GPN, SYF, DAL, TRV)
- **Legend**:
- Orange triangle (↑): "Entered top-20 when named"
- Blue triangle (↓): "Dropped from top-20 when named"
- **Annotations**:
- "Promoted when named" (orange ↑)
- "Demoted when named" (blue ↓)
### Detailed Analysis
1. **Promoted Companies (Orange ↑)**:
- **ELV**: ↑ in Seeds 42, 137, 389, 501 (4/5)
- **CI**: ↑ in Seeds 42, 256, 389, 501 (4/5)
- **CINF**: ↑ in Seeds 137, 389, 501 (3/5)
- **CRM**: ↑ in Seeds 42, 137 (2/5)
- **FSLR**: ↑ in Seeds 137, 501 (2/5)
- **BMY**: ↑ in Seeds 256, 389, 501 (3/5)
- **DELL**: ↑ in Seeds 389, 501 (2/5)
2. **Demoted Companies (Blue ↓)**:
- **CTRA**: ↓ in Seeds 42, 137, 256 (3/5)
- **PRU**: ↓ in Seeds 42, 256, 389 (3/5)
- **NTAP**: ↓ in Seeds 137, 389 (2/5)
- **GPN**: ↓ in Seeds 137, 501 (2/5)
- **SYF**: ↓ in Seeds 256, 501 (2/5)
- **DAL**: ↓ in Seeds 389, 501 (2/5)
- **TRV**: ↓ in Seeds 389, 501 (2/5)
3. **Frequency Column**:
- Promoted companies: 2/5 to 4/5 occurrences
- Demoted companies: 2/5 to 3/5 occurrences
### Key Observations
- **Systematic Bias**:
- 7/14 companies (50%) show ≥3/5 consistent promotion (orange ↑), suggesting undervaluation.
- 7/14 companies (50%) show ≥3/5 consistent demotion (blue ↓), suggesting overvaluation.
- **Outliers**:
- **CINF** (3/5 promotion) and **CTRA** (3/5 demotion) show moderate consistency.
- **CRM**, **FSLR**, **NTAP**, **GPN**, **SYF**, **DAL**, and **TRV** exhibit weaker but still directional trends.
- **Noise vs. Bias**:
- No company shows purely random patterns (e.g., mixed ↑/↓ across seeds), supporting the claim that arrows reflect systematic bias.
### Interpretation
The chart demonstrates that S&P 500 value screen results are not random but influenced by systematic factors. Companies with high promotion frequency (e.g., ELV, CI) may represent undervalued opportunities, while those with high demotion frequency (e.g., CTRA, PRU) may be overvalued. The absence of purely random patterns across seeds reinforces the conclusion that the observed trends are structural rather than noise-driven. This aligns with the subtitle’s assertion that consistent arrows indicate systematic bias, providing actionable insights for value investors.