## Line Chart: Accuracy vs. Thinking Compute for Different Methods
### Overview
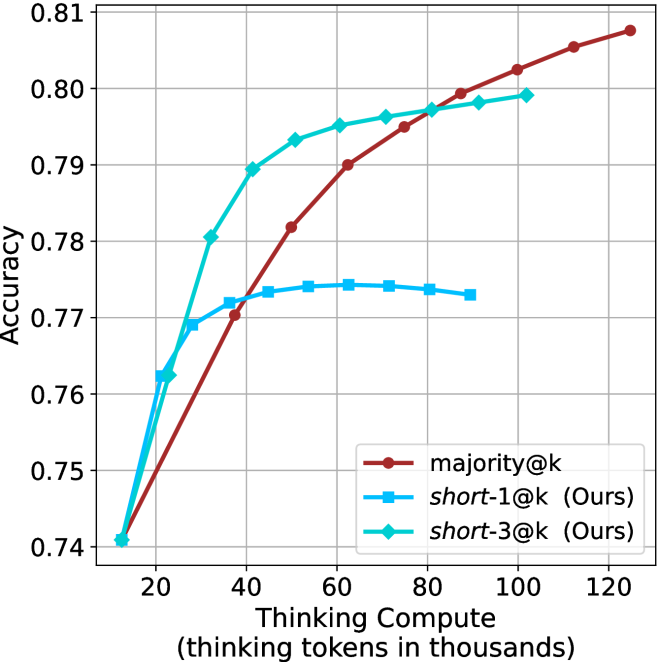
The image is a line chart comparing the performance of three different methods ("majority@k", "short-1@k (Ours)", and "short-3@k (Ours)") in terms of accuracy as a function of thinking compute, measured in thousands of thinking tokens. The chart demonstrates how accuracy scales with increased computational resources for each method.
### Components/Axes
* **Chart Type:** Line chart with markers.
* **X-Axis:**
* **Title:** "Thinking Compute (thinking tokens in thousands)"
* **Scale:** Linear, ranging from approximately 10 to 125.
* **Major Tick Marks:** 20, 40, 60, 80, 100, 120.
* **Y-Axis:**
* **Title:** "Accuracy"
* **Scale:** Linear, ranging from 0.74 to 0.81.
* **Major Tick Marks:** 0.74, 0.75, 0.76, 0.77, 0.78, 0.79, 0.80, 0.81.
* **Legend:**
* **Position:** Bottom-right corner of the chart area.
* **Entries:**
1. `majority@k` - Represented by a red line with circular markers.
2. `short-1@k (Ours)` - Represented by a blue line with square markers.
3. `short-3@k (Ours)` - Represented by a cyan (light blue) line with diamond markers.
### Detailed Analysis
The chart plots three distinct data series. Below is an analysis of each, including approximate data points extracted from the grid.
**1. Data Series: `majority@k` (Red line, circle markers)**
* **Trend:** Shows a steady, near-linear upward slope across the entire range of thinking compute. It starts as the lowest-performing method at low compute but eventually surpasses the others.
* **Approximate Data Points:**
* ~10k tokens: Accuracy ≈ 0.740
* ~40k tokens: Accuracy ≈ 0.770
* ~60k tokens: Accuracy ≈ 0.790
* ~80k tokens: Accuracy ≈ 0.795
* ~100k tokens: Accuracy ≈ 0.802
* ~120k tokens: Accuracy ≈ 0.808
**2. Data Series: `short-1@k (Ours)` (Blue line, square markers)**
* **Trend:** Exhibits a rapid initial increase in accuracy, which then plateaus and slightly declines after approximately 60k thinking tokens. It shows diminishing returns.
* **Approximate Data Points:**
* ~10k tokens: Accuracy ≈ 0.740
* ~20k tokens: Accuracy ≈ 0.762
* ~30k tokens: Accuracy ≈ 0.769
* ~40k tokens: Accuracy ≈ 0.772
* ~60k tokens: Accuracy ≈ 0.774 (peak)
* ~80k tokens: Accuracy ≈ 0.774
* ~90k tokens: Accuracy ≈ 0.773
**3. Data Series: `short-3@k (Ours)` (Cyan line, diamond markers)**
* **Trend:** Shows a very steep initial increase, followed by a continued but more gradual rise. It maintains the highest accuracy for most of the middle range (approx. 30k to 80k tokens) before being overtaken by `majority@k`.
* **Approximate Data Points:**
* ~10k tokens: Accuracy ≈ 0.740
* ~20k tokens: Accuracy ≈ 0.763
* ~30k tokens: Accuracy ≈ 0.780
* ~40k tokens: Accuracy ≈ 0.789
* ~60k tokens: Accuracy ≈ 0.795
* ~80k tokens: Accuracy ≈ 0.797
* ~100k tokens: Accuracy ≈ 0.799
### Key Observations
1. **Convergence at Low Compute:** All three methods start at approximately the same accuracy (≈0.740) when thinking compute is very low (~10k tokens).
2. **Performance Crossover:** There is a notable crossover point between 80k and 100k tokens where the steadily rising `majority@k` line surpasses the `short-3@k` line.
3. **Plateau Behavior:** The `short-1@k` method clearly plateaus, suggesting a limit to its performance gain from additional compute. In contrast, `majority@k` shows no sign of plateauing within the charted range.
4. **Efficiency of "Ours" Methods:** Both methods labeled "(Ours)" achieve higher accuracy than the baseline (`majority@k`) at lower to medium compute budgets (e.g., at 40k tokens, `short-3@k` is ~0.789 vs. `majority@k`'s ~0.770).
### Interpretation
This chart likely comes from a research paper on efficient inference or reasoning in language models, where "thinking tokens" represent intermediate computation steps. The data suggests:
* **Trade-off Between Efficiency and Peak Performance:** The proposed methods (`short-1@k`, `short-3@k`) are more **compute-efficient**, reaching high accuracy levels with fewer thinking tokens. `short-3@k` is particularly effective in the mid-range. However, the baseline `majority@k` method, while less efficient, appears to have a higher **ultimate performance ceiling** if given sufficient compute resources.
* **Methodological Insight:** The "short" methods might involve techniques that truncate or summarize reasoning chains, leading to quick gains but eventual saturation. The `majority@k` method (possibly a form of majority voting over many reasoning paths) scales more predictably with compute, implying it can leverage additional resources to refine answers further without an obvious limit in this range.
* **Practical Implication:** The choice of method depends on the operational constraint. For applications with a strict budget on inference compute (tokens), `short-3@k` is optimal. If maximum accuracy is the goal and compute is less constrained, `majority@k` becomes preferable at higher token counts. The chart provides a clear empirical basis for making this trade-off decision.