```markdown
## Line Chart: Accuracy vs. Thinking Compute (Tokens in Thousands)
### Overview
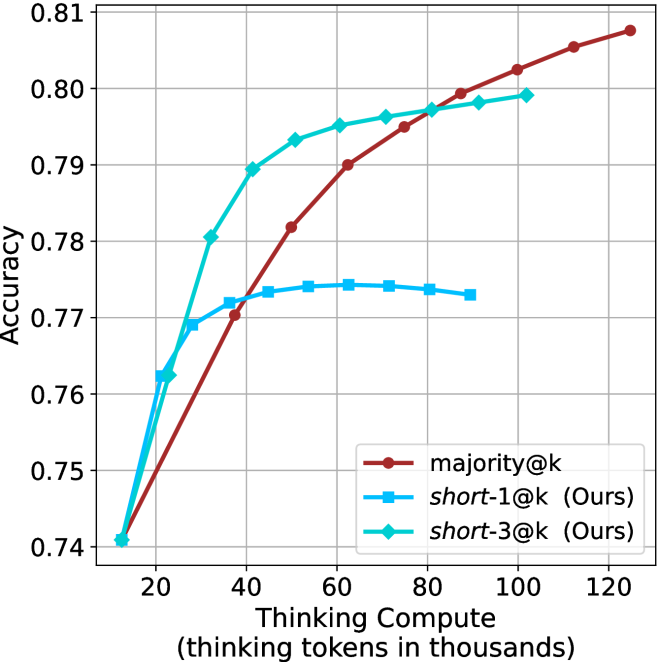
The chart compares the accuracy of three methods—**majority@k**, **short-1@k (Ours)**, and **short-3@k (Ours)**—as a function of "Thinking Compute" (measured in thousands of tokens). The y-axis represents accuracy (0.74–0.81), and the x-axis ranges from 20 to 120 thousand tokens. The data shows distinct trends for each method, with **majority@k** demonstrating the most consistent improvement.
---
### Components/Axes
- **X-axis**: "Thinking Compute (thinking tokens in thousands)" (20–120, in increments of 20).
- **Y-axis**: "Accuracy" (0.74–0.81, in increments of 0.01).
- **Legend**:
- **Red**: majority@k
- **Blue**: short-1@k (Ours)
- **Green**: short-3@k (Ours)
- **Placement**: Legend is positioned at the **bottom-right** of the chart.
---
### Detailed Analysis
#### 1. **majority@k (Red Line)**
- **Trend**: Steadily increases from 0.74 (x=20) to 0.81 (x=120).
- **Key Points**:
- x=20: 0.74
- x=40: 0.77
- x=60: 0.78
- x=80: 0.79
- x=100: 0.80
- x=120: 0.81
#### 2. **short-1@k (Blue Line)**
- **Trend**: Sharp initial rise, then plateaus.
- **Key Points**:
- x=20: 0.74
- x=40: 0.77
- x=60: 0.77
- x=80: 0.77
- x=100: 0.77
- x=120: 0.77
#### 3. **short-3@k (Green Line)**
- **Trend**: Gradual increase, outperforming short-1@k but lagging behind majority@k.
- **Key Points**:
- x=20: 0.74
- x=40: 0.78
- x=60: 0.79
- x=80: 0.79
- x=100: 0.80
- x=120: 0.80
---
### Key Observations
1. **majority@k** shows the most significant improvement, with a **0.07 accuracy gain** over 100 tokens.
2. **short-1@k** plateaus at 0.77 after x