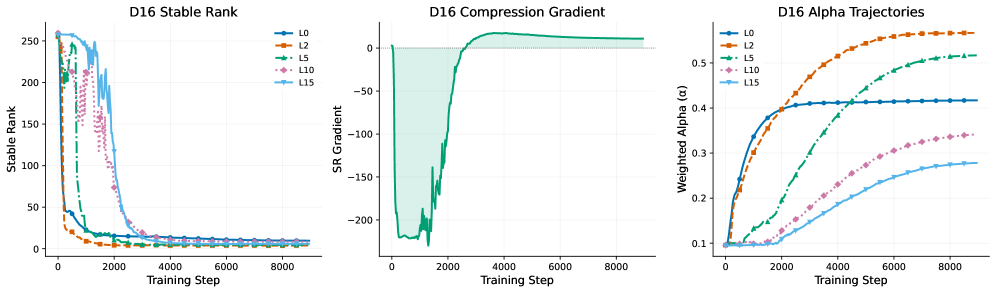
## Composite Chart: D16 Training Metrics
### Overview
The image contains three sub-charts visualizing training dynamics for a D16 model across different label configurations (L0, L2, L5, L10, L15). Each chart tracks distinct metrics: stable rank convergence, compression gradient behavior, and alpha trajectory evolution. All charts share the same x-axis (Training Step: 0–8000) but differ in y-axis metrics and visualization styles.
---
### Components/Axes
#### Common Elements
- **X-axis**: Training Step (0–8000) across all charts
- **Legend**: Positioned right-aligned in all charts, mapping colors to labels:
- **Blue**: L0
- **Orange**: L2
- **Green**: L5
- **Pink**: L10
- **Light Blue**: L15
#### Chart-Specific Axes
1. **D16 Stable Rank**
- **Y-axis**: Stable Rank (0–250)
- **Line Style**: Solid lines with markers (dots/circles)
- **Shading**: None
2. **D16 Compression Gradient**
- **Y-axis**: SR Gradient (-200–0)
- **Line Style**: Solid green line with shaded uncertainty region (light green)
- **Shading**: Gradient fill between line and zero axis
3. **D16 Alpha Trajectories**
- **Y-axis**: Weighted Alpha (0.1–0.55)
- **Line Style**: Solid lines with markers (dots)
- **Shading**: None
---
### Detailed Analysis
#### D16 Stable Rank
- **Trend**: All lines show rapid initial decline (0–2000 steps), followed by plateauing.
- **L0 (Blue)**: Starts at ~250, drops to ~5 by step 2000, stabilizes near 0.
- **L2 (Orange)**: Similar trajectory to L0 but with slightly slower convergence (~10 by step 2000).
- **L5 (Green)**: Slower decline, stabilizes near ~10.
- **L10 (Pink)**: Gradual decline, stabilizes near ~15.
- **L15 (Light Blue)**: Slowest convergence, stabilizes near ~20.
- **Key Data Points**:
- L0: ~250 (step 0) → ~5 (step 2000) → ~0 (step 8000)
- L15: ~250 (step 0) → ~20 (step 8000)
#### D16 Compression Gradient
- **Trend**: Sharp initial drop to ~-200 (step 1000), followed by rapid ascent to near 0 (step 4000), then stabilization.
- **SR Gradient**: Peaks at ~-200 (step 1000), rises to ~-50 (step 2000), stabilizes near 0 (step 4000+).
- **Uncertainty**: Shaded region widest during initial drop, narrowing post-step 2000.
#### D16 Alpha Trajectories
- **Trend**: All lines show gradual upward curves, with higher labels achieving higher alpha values.
- **L0 (Blue)**: Plateaus near 0.42 by step 8000.
- **L2 (Orange)**: Reaches ~0.55 by step 8000.
- **L5 (Green)**: ~0.48 by step 8000.
- **L10 (Pink)**: ~0.33 by step 8000.
- **L15 (Light Blue)**: ~0.27 by step 8000.
- **Key Data Points**:
- L0: ~0.1 (step 0) → ~0.42 (step 8000)
- L2: ~0.1 (step 0) → ~0.55 (step 8000)
---
### Key Observations
1. **Convergence Speed**: Lower labels (L0, L2) converge faster in stable rank and alpha than higher labels (L10, L15).
2. **Compression Dynamics**: The sharp gradient drop suggests an initial phase of aggressive parameter compression, followed by stabilization.
3. **Alpha Correlation**: Higher labels achieve higher alpha values, indicating better generalization or parameter efficiency.
4. **Uncertainty**: The compression gradient's shaded region implies higher variability in early training steps.
---
### Interpretation
- **Training Efficiency**: Lower labels (L0, L2) demonstrate faster convergence in both stable rank and alpha, suggesting they are more effective for rapid model stabilization.
- **Generalization Trade-off**: Higher labels (L10, L15) achieve higher alpha values but converge more slowly, potentially indicating a trade-off between training speed and generalization.
- **Compression Mechanism**: The compression gradient's behavior implies that the model undergoes significant parameter adjustment early in training, which stabilizes as training progresses.
- **Anomalies**: The pink (L10) and light blue (L15) lines in the stable rank chart show atypical "noise" in early steps, possibly due to label-specific training dynamics.
This data suggests that label configuration significantly impacts training dynamics, with lower labels favoring speed and higher labels favoring generalization. The compression gradient's behavior highlights critical phases of parameter adjustment during training.