## Network Diagram: Physics Equations Cluster
### Overview
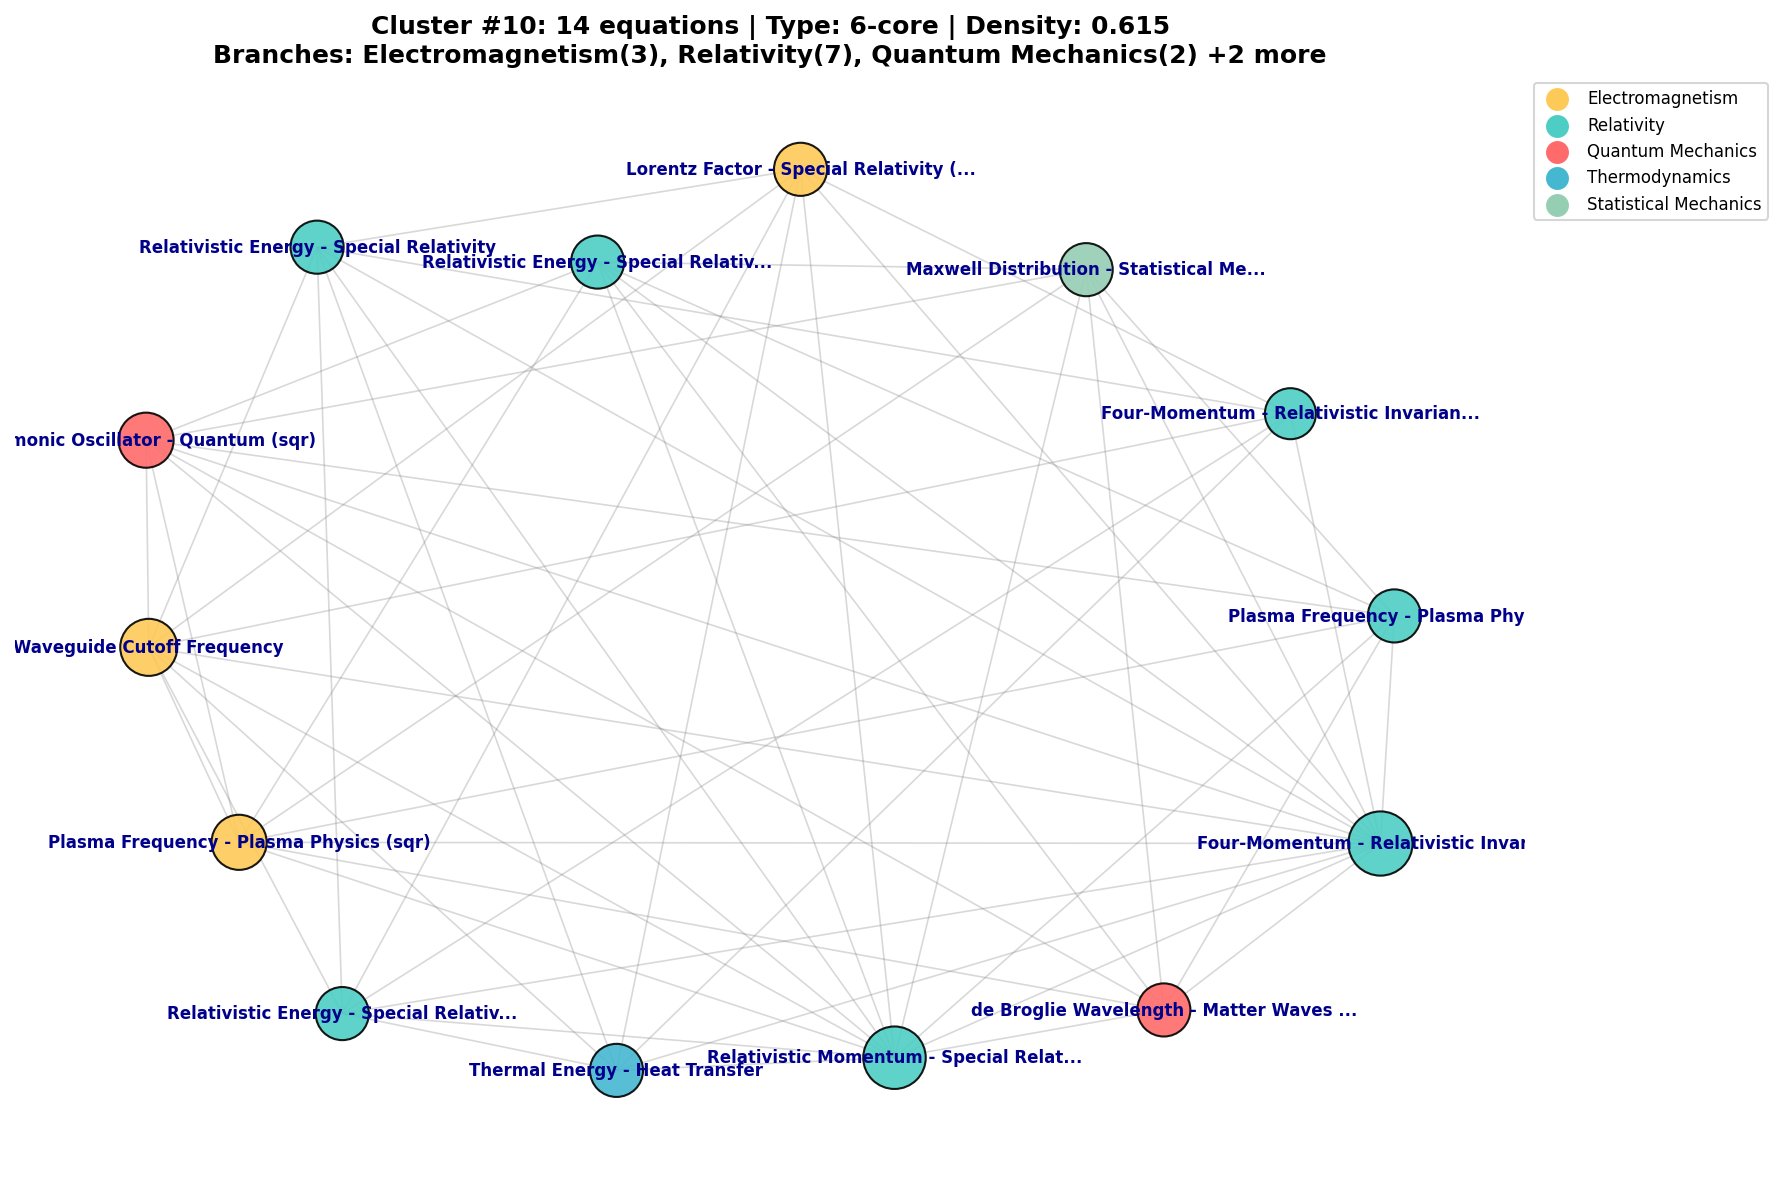
The image is a network diagram visualizing the relationships between different physics equations within a cluster. The nodes represent equations, and the edges represent connections or relationships between them. The nodes are colored based on the branch of physics they belong to. The diagram provides an overview of how different concepts and equations are interconnected within the cluster.
### Components/Axes
* **Title:** Cluster #10: 14 equations | Type: 6-core | Density: 0.615
* **Subtitle:** Branches: Electromagnetism(3), Relativity(7), Quantum Mechanics(2) +2 more
* **Nodes:** Each node represents a physics equation or concept.
* **Edges:** The lines connecting the nodes represent relationships between the equations.
* **Node Colors (Legend, located top-right):**
* Yellow: Electromagnetism
* Teal: Relativity
* Red: Quantum Mechanics
* Salmon: Thermodynamics
* Light Green: Statistical Mechanics
### Detailed Analysis or ### Content Details
**Node Descriptions and Connections:**
* **Electromagnetism (Yellow Nodes):**
* Waveguide Cutoff Frequency (bottom-left)
* Plasma Frequency - Plasma Physics (sqr) (bottom-left)
* Lorentz Factor - Special Relativity (...) (top)
* **Relativity (Teal Nodes):**
* Relativistic Energy - Special Relativity (top-left)
* Relativistic Energy - Special Relati... (top-center)
* Four-Momentum - Relativistic Invarian... (center-right)
* Plasma Frequency - Plasma Phy (center-right)
* Four-Momentum - Relativistic Invar (bottom-right)
* Relativistic Energy - Special Relativ... (bottom-left)
* Thermal Energy - Heat Transfer (bottom-center)
* Relativistic Momentum - Special Relat... (bottom-center)
* **Quantum Mechanics (Red Nodes):**
* nonic Oscillator - Quantum (sqr) (left)
* de Broglie Wavelength - Matter Waves ... (bottom-right)
* **Statistical Mechanics (Light Green Nodes):**
* Maxwell Distribution - Statistical Me... (top-right)
**Connections:** The nodes are interconnected with gray lines, indicating relationships between the equations. The density of connections varies across the diagram.
### Key Observations
* The "Relativity" branch has the most nodes (7), indicating a central role in this cluster.
* The "Electromagnetism" branch has 3 nodes.
* The "Quantum Mechanics" branch has 2 nodes.
* The diagram shows how different branches of physics are interconnected through specific equations.
* The density of connections suggests that certain equations have more relationships with others.
### Interpretation
The network diagram visualizes the relationships between physics equations within a specific cluster. The connections between nodes suggest how different concepts and equations are related to each other. The dominance of "Relativity" suggests that this branch plays a central role in the cluster, with connections to other branches like "Electromagnetism," "Quantum Mechanics," and "Statistical Mechanics." The diagram provides a high-level overview of the interconnectedness of physics concepts within this cluster, potentially highlighting areas where different branches of physics intersect and influence each other. The "Density: 0.615" likely refers to the network density, indicating the ratio of actual connections to possible connections.