\n
## Network Graph: Cluster #10 - Equation Relationships
### Overview
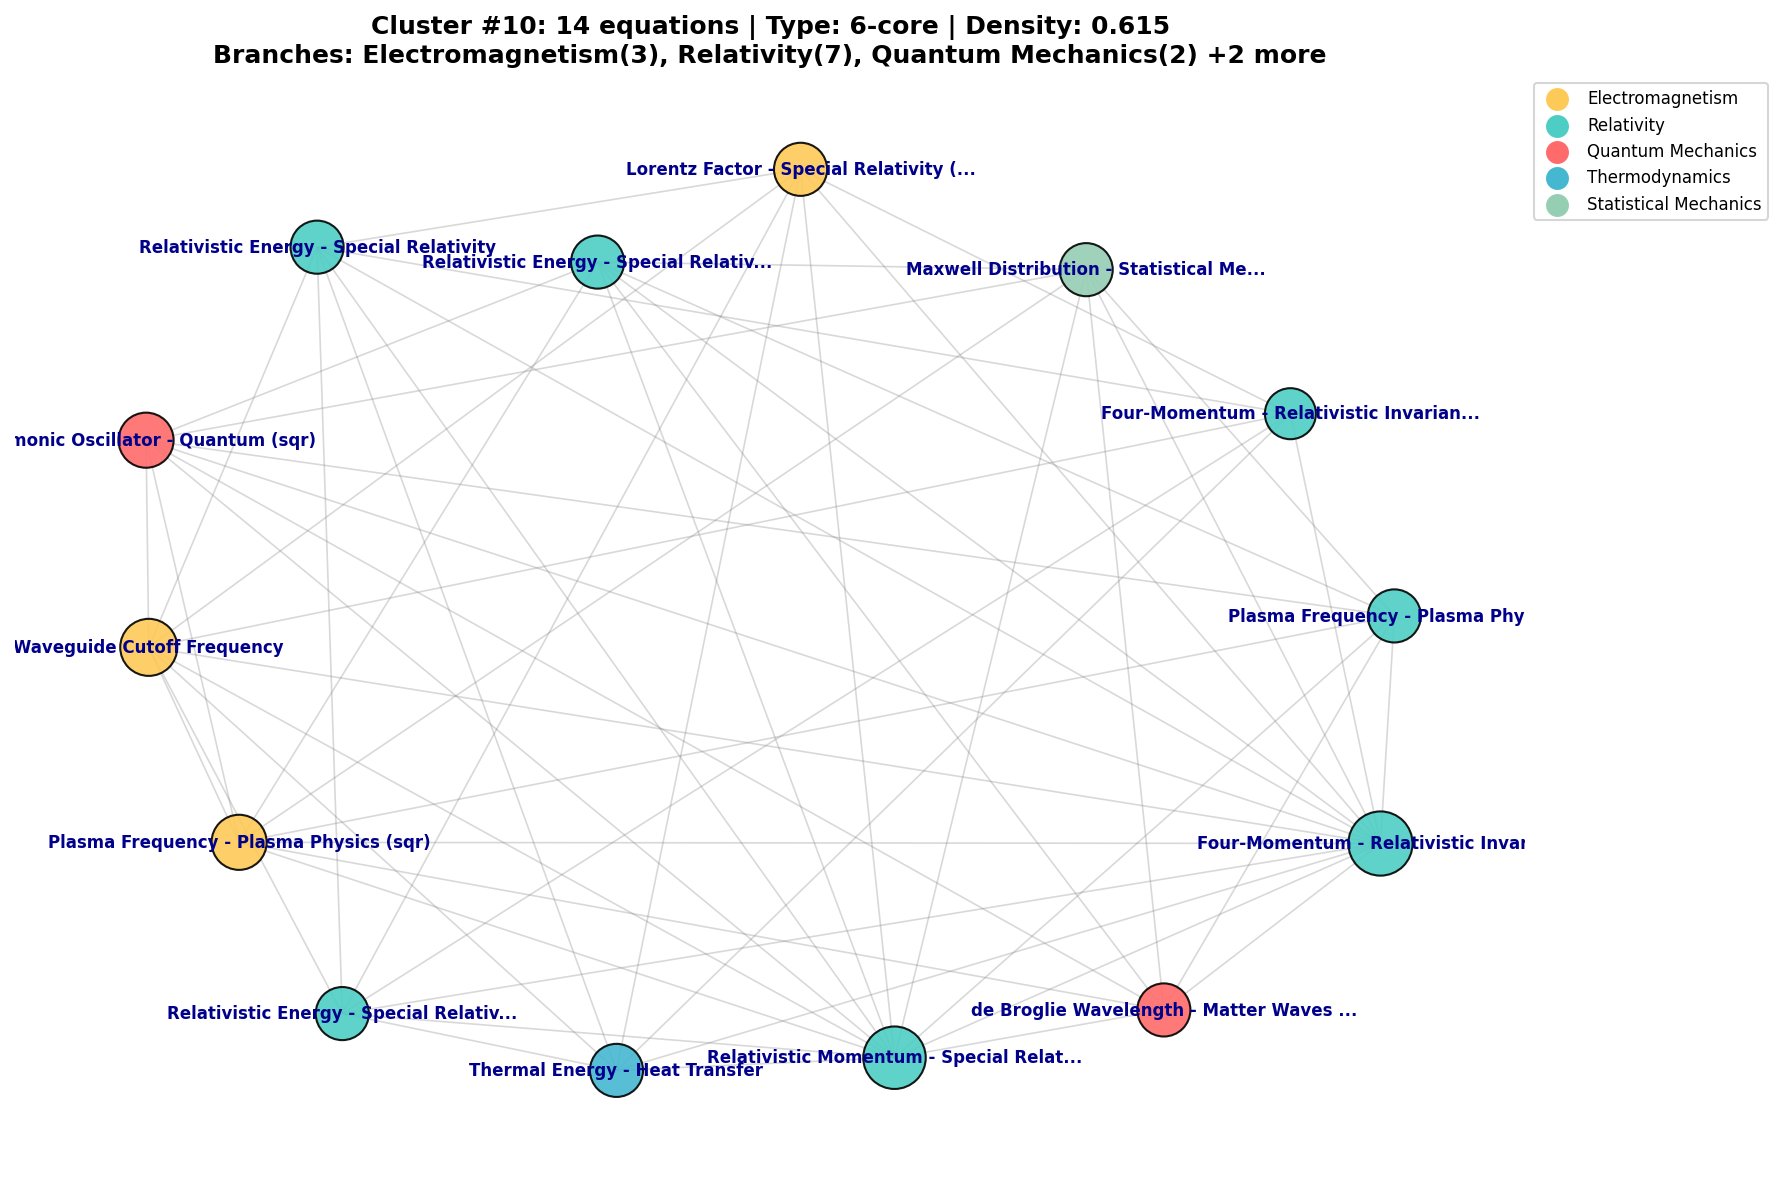
The image presents a network graph visualizing relationships between equations, categorized by scientific domain. The graph consists of nodes representing equations or concepts, connected by edges indicating relationships. Node color represents the primary scientific domain. The graph is titled "Cluster #10: 14 equations | Type: 6-core | Density: 0.615" and indicates branches in Electromagnetism, Relativity, Quantum Mechanics, Thermodynamics, and Statistical Mechanics.
### Components/Axes
* **Title:** Cluster #10: 14 equations | Type: 6-core | Density: 0.615
* **Branches:** Electromagnetism (3), Relativity (7), Quantum Mechanics (2) + 2 more
* **Legend (Top-Right):**
* Teal: Electromagnetism
* Red: Relativity
* Yellow: Quantum Mechanics
* Green: Thermodynamics
* Light Blue: Statistical Mechanics
* **Nodes:** Represent equations or concepts.
* **Edges:** Represent relationships between equations/concepts.
### Detailed Analysis
The graph contains 14 nodes, each labeled with a descriptive phrase. The nodes are interconnected by numerous edges, forming a complex network. The positioning of nodes appears to be determined by the strength or nature of their relationships, though a precise metric is not provided.
Here's a breakdown of the nodes and their connections, categorized by color (and therefore domain):
**Relativity (Red):**
* Lorentz Factor - Special Relativity (...): Connected to Relativistic Energy - Special Relativity, Relativistic Energy - Special Relativ...
* Relativistic Energy - Special Relativity: Connected to Lorentz Factor - Special Relativity (...), Relativistic Energy - Special Relativ..., Four-Momentum - Relativistic Invarian...
* Relativistic Energy - Special Relativ...: Connected to Relativistic Energy - Special Relativity
* Four-Momentum - Relativistic Invarian...: Connected to Relativistic Energy - Special Relativity, Four-Momentum - Relativistic Invar
* Four-Momentum - Relativistic Invar: Connected to Four-Momentum - Relativistic Invarian...
* Relativistic Momentum - Special Relat...: Connected to de Broglie Wavelength - Matter Waves ...
* de Broglie Wavelength - Matter Waves ...: Connected to Relativistic Momentum - Special Relat...
**Quantum Mechanics (Yellow):**
* Harmonic Oscillator - Quantum (sqr): Connected to Waveguide Cutoff Frequency
* Waveguide Cutoff Frequency: Connected to Harmonic Oscillator - Quantum (sqr), Plasma Frequency - Plasma Physics (sqr)
* Plasma Frequency - Plasma Physics (sqr): Connected to Waveguide Cutoff Frequency, Plasma Frequency - Plasma Phy
**Thermodynamics (Green):**
* Thermal Energy - Heat Transfer: Connected to Relativistic Energy - Special Relativ...
**Electromagnetism (Teal):**
* Maxwell Distribution - Statistical Me...: Connected to Relativistic Energy - Special Relativity
**Statistical Mechanics (Light Blue):**
* Plasma Frequency - Plasma Phy: Connected to Plasma Frequency - Plasma Physics (sqr)
The graph's density is reported as 0.615, suggesting a relatively high degree of interconnectedness between the nodes.
### Key Observations
* Relativity is the most represented domain with 7 nodes.
* The "Relativistic Energy" node appears to be a central hub, connected to multiple other nodes.
* Quantum Mechanics and Thermodynamics have fewer nodes and connections, suggesting less direct interaction within this cluster.
* The graph is relatively dense, indicating many relationships between the equations.
### Interpretation
This network graph illustrates the interconnectedness of concepts across different branches of physics. The central role of "Relativistic Energy" suggests its fundamental importance in linking various equations and theories. The graph likely represents a simplified view of a more complex system, focusing on the most significant relationships within a specific cluster of equations. The density of the graph indicates a strong interplay between these concepts. The categorization by color allows for a quick visual assessment of the dominant domains within the cluster. The presence of "(sqr)" in some labels suggests these equations involve square root operations. The graph could be used to identify potential areas for further research or to visualize the structure of a complex physical system. The "6-core" type suggests that the graph is a core structure, meaning it represents the most important connections within a larger network.