## Scatter Plot: Accuracy vs. Time-to-Answer for Different k Values
### Overview
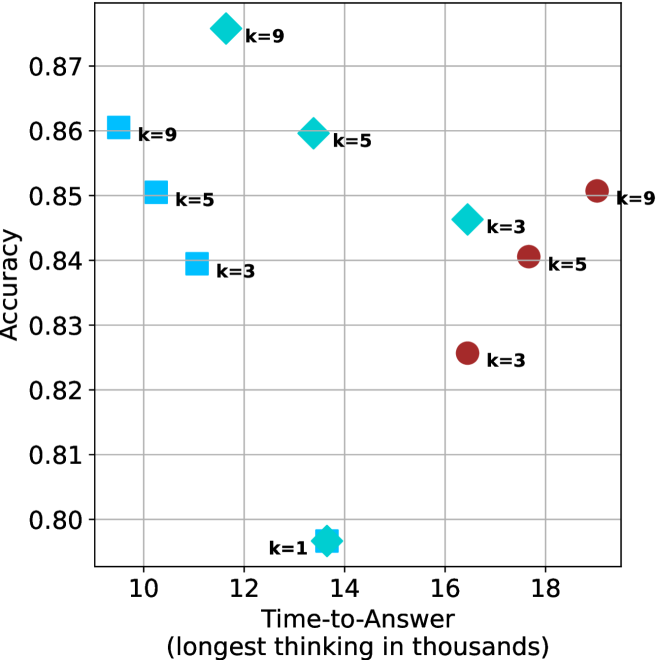
The image is a scatter plot comparing **accuracy** (y-axis) and **time-to-answer** (x-axis, in thousands of units) for three distinct configurations labeled by `k` values (3, 5, 9). Data points are color-coded and shaped uniquely per `k` value, with annotations for specific `k` and time-to-answer pairs.
---
### Components/Axes
- **X-axis (Time-to-Answer)**: Labeled "Time-to-Answer (longest in thousands)", ranging from 10 to 18 (in thousands).
- **Y-axis (Accuracy)**: Labeled "Accuracy", ranging from 0.80 to 0.87.
- **Legend**: Located on the right, mapping:
- **Blue squares**: `k=3`
- **Cyan diamonds**: `k=5`
- **Red circles**: `k=9`
- **Annotations**: Direct labels for `k` values and time-to-answer pairs (e.g., `k=9` at 12k, `k=5` at 14k).
---
### Detailed Analysis
#### Data Points by `k` Value
1. **`k=3` (Blue Squares)**:
- (10k, 0.84)
- (16k, 0.83)
- (18k, 0.83)
2. **`k=5` (Cyan Diamonds)**:
- (10k, 0.85)
- (14k, 0.86)
- (16k, 0.84)
- (18k, 0.84)
3. **`k=9` (Red Circles)**:
- (10k, 0.86)
- (12k, 0.87)
- (16k, 0.85)
- (18k, 0.85)
4. **`k=1` (Cyan Star)**:
- (14k, 0.80) – Outlier with lowest accuracy.
---
### Key Observations
1. **Accuracy vs. Time Trade-off**:
- Higher `k` values (e.g., `k=9`) generally achieve higher accuracy but require longer time-to-answer.
- Example: `k=9` at 12k achieves 0.87 accuracy, while `k=3` at 10k achieves 0.84 accuracy.
2. **Non-linear Relationships**:
- `k=5` at 14k (0.86 accuracy) outperforms `k=9` at 16k (0.85 accuracy) despite shorter time.
- `k=1` at 14k (0.80 accuracy) is an outlier, underperforming all other `k` values.
3. **Consistency**:
- `k=9` maintains high accuracy (0.85–0.87) across all time-to-answer values.
- `k=3` shows diminishing returns, with accuracy plateauing at 0.83 for longer times.
---
### Interpretation
- **Trade-off Insight**: Increasing `k` improves accuracy but increases computational cost (time). For applications prioritizing speed, `k=3` or `k=5` may be preferable, while `k=9` is optimal for accuracy-critical tasks.
- **Anomaly**: The `k=1` point (0.80 accuracy at 14k) suggests that very low `k` values may fail to generalize, despite moderate time investment.
- **Efficiency**: `k=5` balances accuracy (0.84–0.86) and time (10k–16k), making it a pragmatic choice for many use cases.
---
### Spatial Grounding & Verification
- **Legend Placement**: Right-aligned, clearly associating colors/shapes with `k` values.
- **Data Point Consistency**: All markers match their legend labels (e.g., red circles = `k=9`).
- **Trend Verification**:
- `k=9` slopes upward (higher accuracy with longer time).
- `k=3` shows a slight downward trend (lower accuracy with longer time).
- `k=5` exhibits a peak at 14k before plateauing.
---
### Conclusion
The plot demonstrates that higher `k` values improve accuracy at the expense of time, with `k=9` being the most accurate but slowest. `k=5` offers a balanced middle ground, while `k=3` and `k=1` underperform in accuracy. The outlier `k=1` highlights the importance of selecting `k` based on both performance and resource constraints.