## Histogram: Relative Length Difference Distribution
### Overview
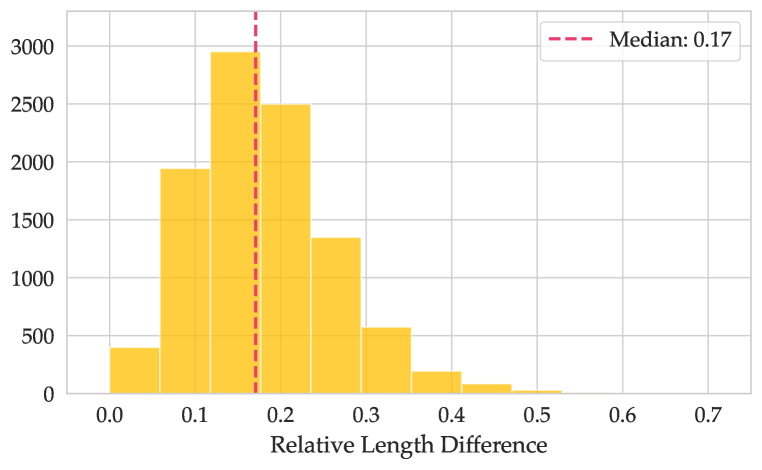
The image is a histogram showing the distribution of "Relative Length Difference". The x-axis represents the relative length difference, and the y-axis represents the frequency or count. The histogram bars are colored yellow. A vertical dashed red line indicates the median value at 0.17.
### Components/Axes
* **X-axis:** "Relative Length Difference", ranging from 0.0 to 0.7 in increments of 0.1.
* **Y-axis:** Frequency/Count, ranging from 0 to 3000 in increments of 500.
* **Bars:** Yellow bars representing the frequency of each relative length difference range.
* **Median Line:** A vertical dashed red line indicating the median value of 0.17.
* **Legend:** Located in the top-right corner, indicating that the dashed red line represents the "Median: 0.17".
### Detailed Analysis
The histogram shows the frequency distribution of the relative length difference. The highest frequency occurs around 0.1 to 0.2. The frequency decreases as the relative length difference increases beyond 0.2.
Here's a breakdown of the approximate counts for each bin:
* 0.0 - 0.1: Approximately 400
* 0.1 - 0.2: Approximately 2950
* 0.2 - 0.3: Approximately 2500
* 0.3 - 0.4: Approximately 1350
* 0.4 - 0.5: Approximately 550
* 0.5 - 0.6: Approximately 200
* 0.6 - 0.7: Approximately 50
The median is marked at 0.17 by a dashed red line.
### Key Observations
* The distribution is right-skewed, indicating that there are more instances with smaller relative length differences.
* The peak of the distribution is between 0.1 and 0.2.
* The median (0.17) is slightly to the right of the peak, which is consistent with a right-skewed distribution.
### Interpretation
The histogram illustrates the distribution of relative length differences in a dataset. The right-skewness suggests that smaller relative length differences are more common than larger ones. The median value of 0.17 provides a measure of central tendency, indicating that half of the data points have a relative length difference below 0.17, and half have a value above it. The distribution could represent measurement errors, variations in manufacturing, or other factors that cause differences in length. The shape of the distribution and the location of the median provide insights into the nature and magnitude of these differences.