\n
## Histogram: Relative Length Difference Distribution
### Overview
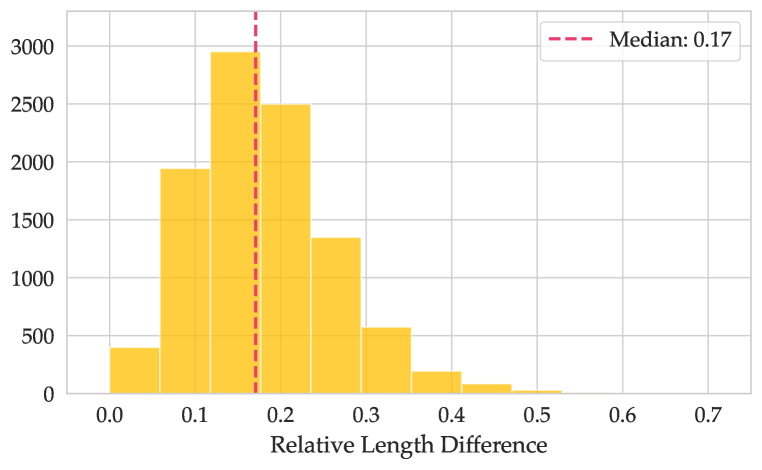
The image presents a histogram visualizing the distribution of "Relative Length Difference". The x-axis represents the relative length difference, and the y-axis represents the frequency or count. A vertical dashed line indicates the median value.
### Components/Axes
* **X-axis Title:** "Relative Length Difference"
* **X-axis Scale:** Ranges from 0.0 to 0.7, with markings at 0.1 intervals.
* **Y-axis Title:** (Implicitly) Frequency or Count.
* **Y-axis Scale:** Ranges from 0 to 3000, with markings at 500 intervals.
* **Legend:** Located in the top-right corner.
* **Label:** "Median: 0.17"
* **Color:** Red (dashed line)
* **Data Series:** A single histogram series represented by yellow bars.
* **Median Line:** A vertical dashed red line at approximately x = 0.17.
### Detailed Analysis
The histogram shows a distribution that is skewed to the right. The highest frequency occurs between 0.1 and 0.2. The distribution decreases as the relative length difference increases beyond 0.2.
Here's an approximate breakdown of the bar heights (frequencies) based on the x-axis intervals:
* 0.0 - 0.1: Approximately 400
* 0.1 - 0.2: Approximately 3000
* 0.2 - 0.3: Approximately 2400
* 0.3 - 0.4: Approximately 1300
* 0.4 - 0.5: Approximately 300
* 0.5 - 0.6: Approximately 100
* 0.6 - 0.7: Approximately 50
The median value, indicated by the dashed red line, is at approximately 0.17.
### Key Observations
* The distribution is not symmetrical. It is positively skewed, meaning there is a longer tail on the right side.
* The majority of the relative length differences fall between 0.1 and 0.3.
* There are relatively few instances of relative length differences greater than 0.4.
* The median is slightly shifted to the left of the peak, indicating a slight skewness.
### Interpretation
This data likely represents the differences in length between two sets of measurements or objects. The distribution suggests that most of the lengths are relatively similar (small relative length difference), while a smaller proportion exhibit larger differences. The median value of 0.17 provides a central tendency measure, indicating that, on average, the lengths differ by about 17%.
The skewness could indicate a systematic bias in the measurements or a natural variation in the objects being measured. For example, if measuring the length of manufactured parts, the skewness might suggest that the manufacturing process tends to produce parts that are slightly shorter than the target length. Further investigation would be needed to determine the cause of the skewness and its implications. The relatively low counts for values above 0.4 suggest that large length differences are rare.