\n
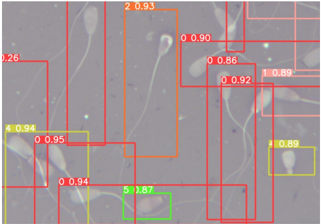
## Annotated Microscopic Image: Object Detection with Confidence Scores
### Overview
This is a grayscale microscopic image, likely of biological samples (possibly sperm cells based on morphology), overlaid with colored bounding boxes and numerical annotations. The annotations appear to be the output of an object detection or classification algorithm, identifying individual structures and assigning them class labels and confidence scores.
### Components/Axes
* **Image Background:** A grayscale micrograph showing numerous elongated, curved, filamentous structures with distinct head regions, consistent with spermatozoa.
* **Annotations:** Colored rectangular bounding boxes drawn around detected objects. Each box is accompanied by a text label in the format `[Class ID] [Confidence Score]`.
* **Annotation Colors & Labels:**
* **Red Boxes:** Primarily associated with Class `0`. Also one instance of Class `2`.
* **Yellow Boxes:** Associated with Class `1` and Class `4`.
* **Green Box:** Associated with Class `5`.
* **Spatial Layout:** Annotations are distributed across the entire field of view, with no single dominant cluster. The legend (color-to-class mapping) is implicit in the labels next to each box.
### Detailed Analysis: Annotation Extraction
The following table lists every visible annotation, extracted by scanning the image from top-left to bottom-right. The spatial grounding is approximate.
| Approximate Position | Box Color | Extracted Text (Class ID, Confidence) |
| :--- | :--- | :--- |
| Top-left quadrant | Red | `0 0.94` |
| Top-center | Red | `2 0.93` |
| Top-right quadrant | Red | `0 0.90` |
| Upper-right area | Red | `0 0.86` |
| Upper-right area | Red | `0 0.92` |
| Far-right edge | Yellow | `1 0.89` |
| Left-center | Yellow | `4 0.94` |
| Left-center (below above) | Red | `0 0.95` |
| Bottom-left quadrant | Red | `0 0.94` |
| Bottom-center | Green | `5 0.87` |
| Bottom-right quadrant | Yellow | `1 0.89` |
**Trend Verification:** The confidence scores are uniformly high, ranging from 0.86 to 0.95. There is no visual trend in confidence relative to position or class. Class `0` (red boxes) is the most frequently detected class.
### Key Observations
1. **High Confidence:** All detected objects have confidence scores above 0.85, suggesting the detection model is highly certain about its identifications.
2. **Class Imbalance:** Class `0` is the most prevalent, with 6 detections. Classes `1`, `2`, `4`, and `5` have 2, 1, 1, and 1 detections respectively.
3. **Color-Class Mapping:** The color of the bounding box is consistently tied to the class ID:
* Red = Class `0` or `2`
* Yellow = Class `1` or `4`
* Green = Class `5`
4. **Object Density:** The detected objects are densely packed, particularly in the upper-right quadrant, where multiple red boxes (`0 0.90`, `0 0.86`, `0 0.92`) overlap or are in close proximity.
### Interpretation
This image represents the output of a computer vision model trained to detect and classify microscopic biological entities. The primary function is **automated identification and quantification**.
* **What the data suggests:** The model successfully identifies numerous individual cells with high confidence. The different class IDs (`0`, `1`, `2`, `4`, `5`) likely correspond to different morphological types, vitality states (e.g., live vs. dead), or possibly artifacts. The dominance of Class `0` suggests it may represent the "normal" or most common category in this sample.
* **How elements relate:** The bounding boxes isolate individual objects from the complex background, enabling counting and measurement. The confidence score provides a metric for the reliability of each detection, which is crucial for downstream analysis.
* **Notable anomalies:** The presence of Class `2` (red box, `0 93`) is singular and may represent a rare subtype or a misclassification. The overlapping boxes in the dense region could pose a challenge for accurate counting, potentially leading to double-counting if post-processing is not applied.
* **Underlying purpose:** This type of analysis is fundamental in fields like andrology, reproductive biology, or toxicology, where assessing sperm count, concentration, and morphology is critical. The automated system provides an objective, high-throughput alternative to manual microscopy.