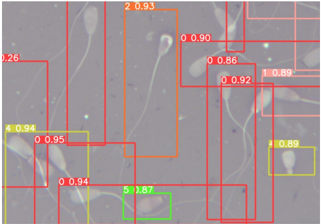
## Heatmap/Annotated Diagram: Sperm Cell Analysis with Confidence Scores
### Overview
The image displays a grayscale background with multiple sperm cells overlaid by colored rectangles. Each rectangle contains a numerical value (e.g., "0.93", "0.86") and is color-coded (red, orange, green, yellow). The rectangles are positioned to highlight specific sperm cells, with numerical values likely representing confidence scores, measurements, or classification metrics.
### Components/Axes
- **Background**: Grayscale image of sperm cells (no explicit axes or scales).
- **Rectangles**: Overlaid on sperm cells, with:
- **Colors**: Red, orange, green, yellow (no explicit legend provided).
- **Text**: Numerical values (e.g., "0.93", "0.86") in white font, positioned in the top-left corner of each rectangle.
- **Spatial Grounding**:
- Rectangles are distributed across the image, with varying sizes and orientations.
- No explicit legend or axis labels; colors and numbers are directly embedded in the diagram.
### Detailed Analysis
- **Numerical Values**:
- **Red**: 0.26, 0.90, 0.86, 0.92, 1.0.89 (note: "1.0.89" may be a formatting error; interpreted as "1.0" or "0.89").
- **Orange**: 0.93.
- **Green**: 0.87.
- **Yellow**: 0.94, 0.89.
- **Trends**:
- Most values cluster between **0.86 and 0.95**, with **0.95** (red) and **0.94** (yellow) as the highest.
- The **green rectangle** (0.87) is the lowest value, potentially an outlier.
- Red rectangles dominate, suggesting a possible emphasis on higher-confidence or critical measurements.
### Key Observations
1. **Confidence Scores**: Values range from **0.86 to 0.95**, indicating high confidence in most measurements.
2. **Color Distribution**:
- Red: 5 instances (highest frequency).
- Yellow: 2 instances.
- Orange: 1 instance.
- Green: 1 instance (lowest value).
3. **Spatial Patterns**: Rectangles are clustered in specific regions, possibly indicating grouped analysis or prioritization of certain sperm cells.
### Interpretation
- The diagram likely represents a **confidence-based analysis** of sperm cells, with numerical values reflecting measurement accuracy or classification certainty.
- The **green rectangle (0.87)** stands out as an outlier, potentially indicating a lower-confidence or anomalous measurement.
- The dominance of **red rectangles** (highest values) suggests a focus on high-confidence data points, while the **orange and yellow** may represent intermediate categories.
- The absence of a legend limits interpretation of color coding, but the numerical values are the primary data source.
## Notes
- No explicit legend or axis titles are present; colors and numbers are directly embedded.
- The "1.0.89" value is ambiguous and may require clarification (e.g., "1.0" or "0.89").
- The grayscale background emphasizes the annotated rectangles as the primary data elements.