# Technical Data Extraction: Accuracy vs. Model Generation Budget
## 1. Document Overview
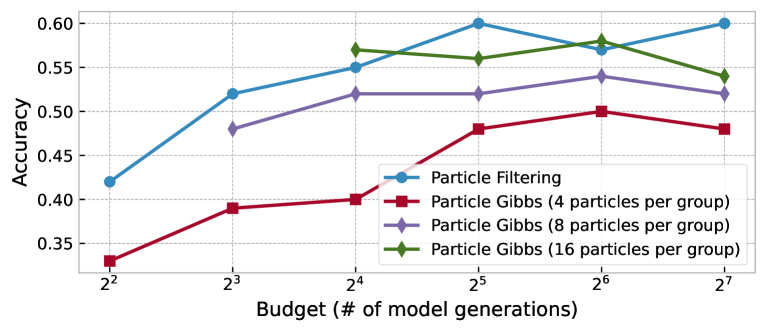
This image is a line graph comparing the performance (Accuracy) of different sampling algorithms—**Particle Filtering** and three variants of **Particle Gibbs**—across an increasing computational budget.
## 2. Component Isolation
### Header/Metadata
* **Language:** English
* **Primary Subject:** Algorithm performance comparison.
### Main Chart Area (Axes and Grid)
* **Y-Axis Label:** `Accuracy`
* **Y-Axis Scale:** Linear, ranging from `0.35` to `0.60` with major tick intervals of `0.05`.
* **X-Axis Label:** `Budget (# of model generations)`
* **X-Axis Scale:** Logarithmic (base 2), with markers at $2^2$, $2^3$, $2^4$, $2^5$, $2^6$, and $2^7$.
* **Grid:** Light grey dashed grid lines for both horizontal and vertical axes.
### Legend (Spatial Grounding: Bottom Right [x≈0.7, y≈0.2])
The legend identifies four distinct data series:
1. **Blue line with Circle markers (●):** `Particle Filtering`
2. **Red line with Square markers (■):** `Particle Gibbs (4 particles per group)`
3. **Purple line with Diamond markers (♦):** `Particle Gibbs (8 particles per group)`
4. **Green line with Diamond markers (♦):** `Particle Gibbs (16 particles per group)`
---
## 3. Trend Verification and Data Extraction
### Series 1: Particle Filtering (Blue, Circle)
* **Trend:** Shows a strong upward trajectory from $2^2$ to $2^5$, reaching a peak. It experiences a slight dip at $2^6$ before recovering to its peak value at $2^7$. Generally the highest performing method.
* **Data Points:**
* $2^2$: ~0.42
* $2^3$: ~0.52
* $2^4$: ~0.55
* $2^5$: ~0.60
* $2^6$: ~0.57
* $2^7$: ~0.60
### Series 2: Particle Gibbs (4 particles per group) (Red, Square)
* **Trend:** The lowest performing series. It shows a steady, slow upward trend as the budget increases, with a slight plateau between $2^3$ and $2^4$, and a small dip at the final point ($2^7$).
* **Data Points:**
* $2^2$: ~0.33
* $2^3$: ~0.39
* $2^4$: ~0.40
* $2^5$: ~0.48
* $2^6$: ~0.50
* $2^7$: ~0.48
### Series 3: Particle Gibbs (8 particles per group) (Purple, Diamond)
* **Trend:** Starts at $2^3$. Shows a consistent upward trend until $2^6$, followed by a slight decrease at $2^7$. It consistently performs better than the 4-particle variant but lower than the 16-particle variant.
* **Data Points:**
* $2^3$: ~0.48
* $2^4$: ~0.52
* $2^5$: ~0.52 (Plateau)
* $2^6$: ~0.54
* $2^7$: ~0.52
### Series 4: Particle Gibbs (16 particles per group) (Green, Diamond)
* **Trend:** Starts at $2^4$. It begins at a high accuracy level, remains relatively stable (slight fluctuations), peaks at $2^6$, and then declines at $2^7$.
* **Data Points:**
* $2^4$: ~0.57
* $2^5$: ~0.56
* $2^6$: ~0.58
* $2^7$: ~0.54
---
## 4. Reconstructed Data Table (Estimated Values)
| Budget ($2^n$) | Particle Filtering (Blue) | PG (4 particles) (Red) | PG (8 particles) (Purple) | PG (16 particles) (Green) |
| :--- | :--- | :--- | :--- | :--- |
| **$2^2$ (4)** | 0.42 | 0.33 | N/A | N/A |
| **$2^3$ (8)** | 0.52 | 0.39 | 0.48 | N/A |
| **$2^4$ (16)** | 0.55 | 0.40 | 0.52 | 0.57 |
| **$2^5$ (32)** | 0.60 | 0.48 | 0.52 | 0.56 |
| **$2^6$ (64)** | 0.57 | 0.50 | 0.54 | 0.58 |
| **$2^7$ (128)** | 0.60 | 0.48 | 0.52 | 0.54 |
---
## 5. Key Observations
* **Scalability:** All methods generally improve as the budget increases, though most show a slight performance degradation or plateau at the highest budget ($2^7$).
* **Particle Gibbs Scaling:** Increasing the number of particles per group in the Particle Gibbs algorithm significantly improves accuracy for a given budget.
* **Efficiency:** Particle Filtering appears to be the most efficient algorithm shown, achieving higher accuracy at lower budgets compared to the Particle Gibbs variants.