# Technical Document Extraction: Line Chart Analysis
## 1. Chart Type and Overview
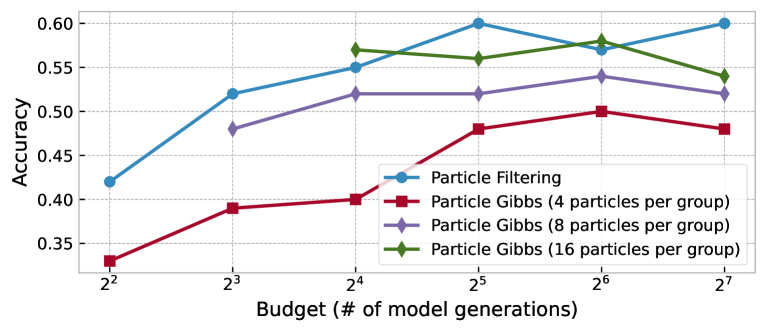
- **Chart Type**: Line chart with four data series.
- **Purpose**: Visualizes accuracy trends across different computational budgets for particle-based methods.
## 2. Axis Labels and Scales
- **X-Axis (Horizontal)**:
- Label: `Budget (# of model generations)`
- Values: `2²` to `2⁷` (exponential scale: 4, 8, 16, 32, 64, 128)
- **Y-Axis (Vertical)**:
- Label: `Accuracy`
- Range: `0.35` to `0.60` (increments of `0.05`)
## 3. Legend and Data Series
- **Legend Position**: Right side of the plot (outside the chart area).
- **Data Series**:
1. **Particle Filtering**
- Marker: Blue circle (`●`)
- Color: Blue (`#0077be`)
- Trend: Starts at `0.42` (2²), rises sharply to `0.60` (2⁵), then plateaus with minor fluctuations.
2. **Particle Gibbs (4 particles per group)**
- Marker: Red square (`■`)
- Color: Red (`#e41a1c`)
- Trend: Gradual upward slope from `0.33` (2²) to `0.48` (2⁷).
3. **Particle Gibbs (8 particles per group)**
- Marker: Purple diamond (`◇`)
- Color: Purple (`#6a3d9a`)
- Trend: Starts at `0.48` (2³), plateaus at `0.52` (2⁴–2⁵), then rises to `0.54` (2⁷).
4. **Particle Gibbs (16 particles per group)**
- Marker: Green diamond (`◇`)
- Color: Green (`#228b22`)
- Trend: Peaks at `0.57` (2⁴), dips to `0.54` (2⁷) with intermediate fluctuations.
## 4. Key Data Points
| Budget (2<sup>n</sup>) | Particle Filtering | Particle Gibbs (4) | Particle Gibbs (8) | Particle Gibbs (16) |
|-----------------------|--------------------|--------------------|--------------------|--------------------|
| 2² (4) | 0.42 | 0.33 | — | — |
| 2³ (8) | 0.52 | 0.39 | 0.48 | — |
| 2⁴ (16) | 0.55 | 0.40 | 0.52 | 0.57 |
| 2⁵ (32) | 0.60 | 0.48 | 0.52 | 0.56 |
| 2⁶ (64) | 0.57 | 0.50 | 0.54 | 0.58 |
| 2⁷ (128) | 0.60 | 0.48 | 0.52 | 0.54 |
## 5. Trend Verification
- **Particle Filtering**:
- Sharp increase from `2²` to `2⁵` (0.42 → 0.60), then stabilizes with minor dips (e.g., 0.57 at 2⁶).
- **Particle Gibbs (4 particles)**:
- Linear growth across all budgets (0.33 → 0.48).
- **Particle Gibbs (8 particles)**:
- Initial plateau (0.48 at 2³–2⁴), followed by gradual improvement (0.52 → 0.54).
- **Particle Gibbs (16 particles)**:
- Highest initial performance (0.57 at 2⁴), followed by decline (0.54 at 2⁷).
## 6. Spatial Grounding
- **Legend Placement**: Right-aligned, outside the plot boundary.
- **Color Consistency**:
- All data points match legend colors (e.g., blue circles for Particle Filtering, red squares for 4-particle Gibbs).
## 7. Observations
- **Performance Trends**:
- Particle Filtering achieves the highest accuracy (0.60) but plateaus at larger budgets.
- Particle Gibbs methods show diminishing returns with increased particle counts (e.g., 16 particles underperform 8 particles at 2⁷).
- **Efficiency**:
- Particle Filtering requires fewer computational resources (lower budget) to achieve comparable accuracy to Particle Gibbs (16 particles).
## 8. Missing Elements
- No embedded text blocks, data tables, or non-English content detected.