# Technical Document Extraction: Line Chart Analysis
## Chart Overview
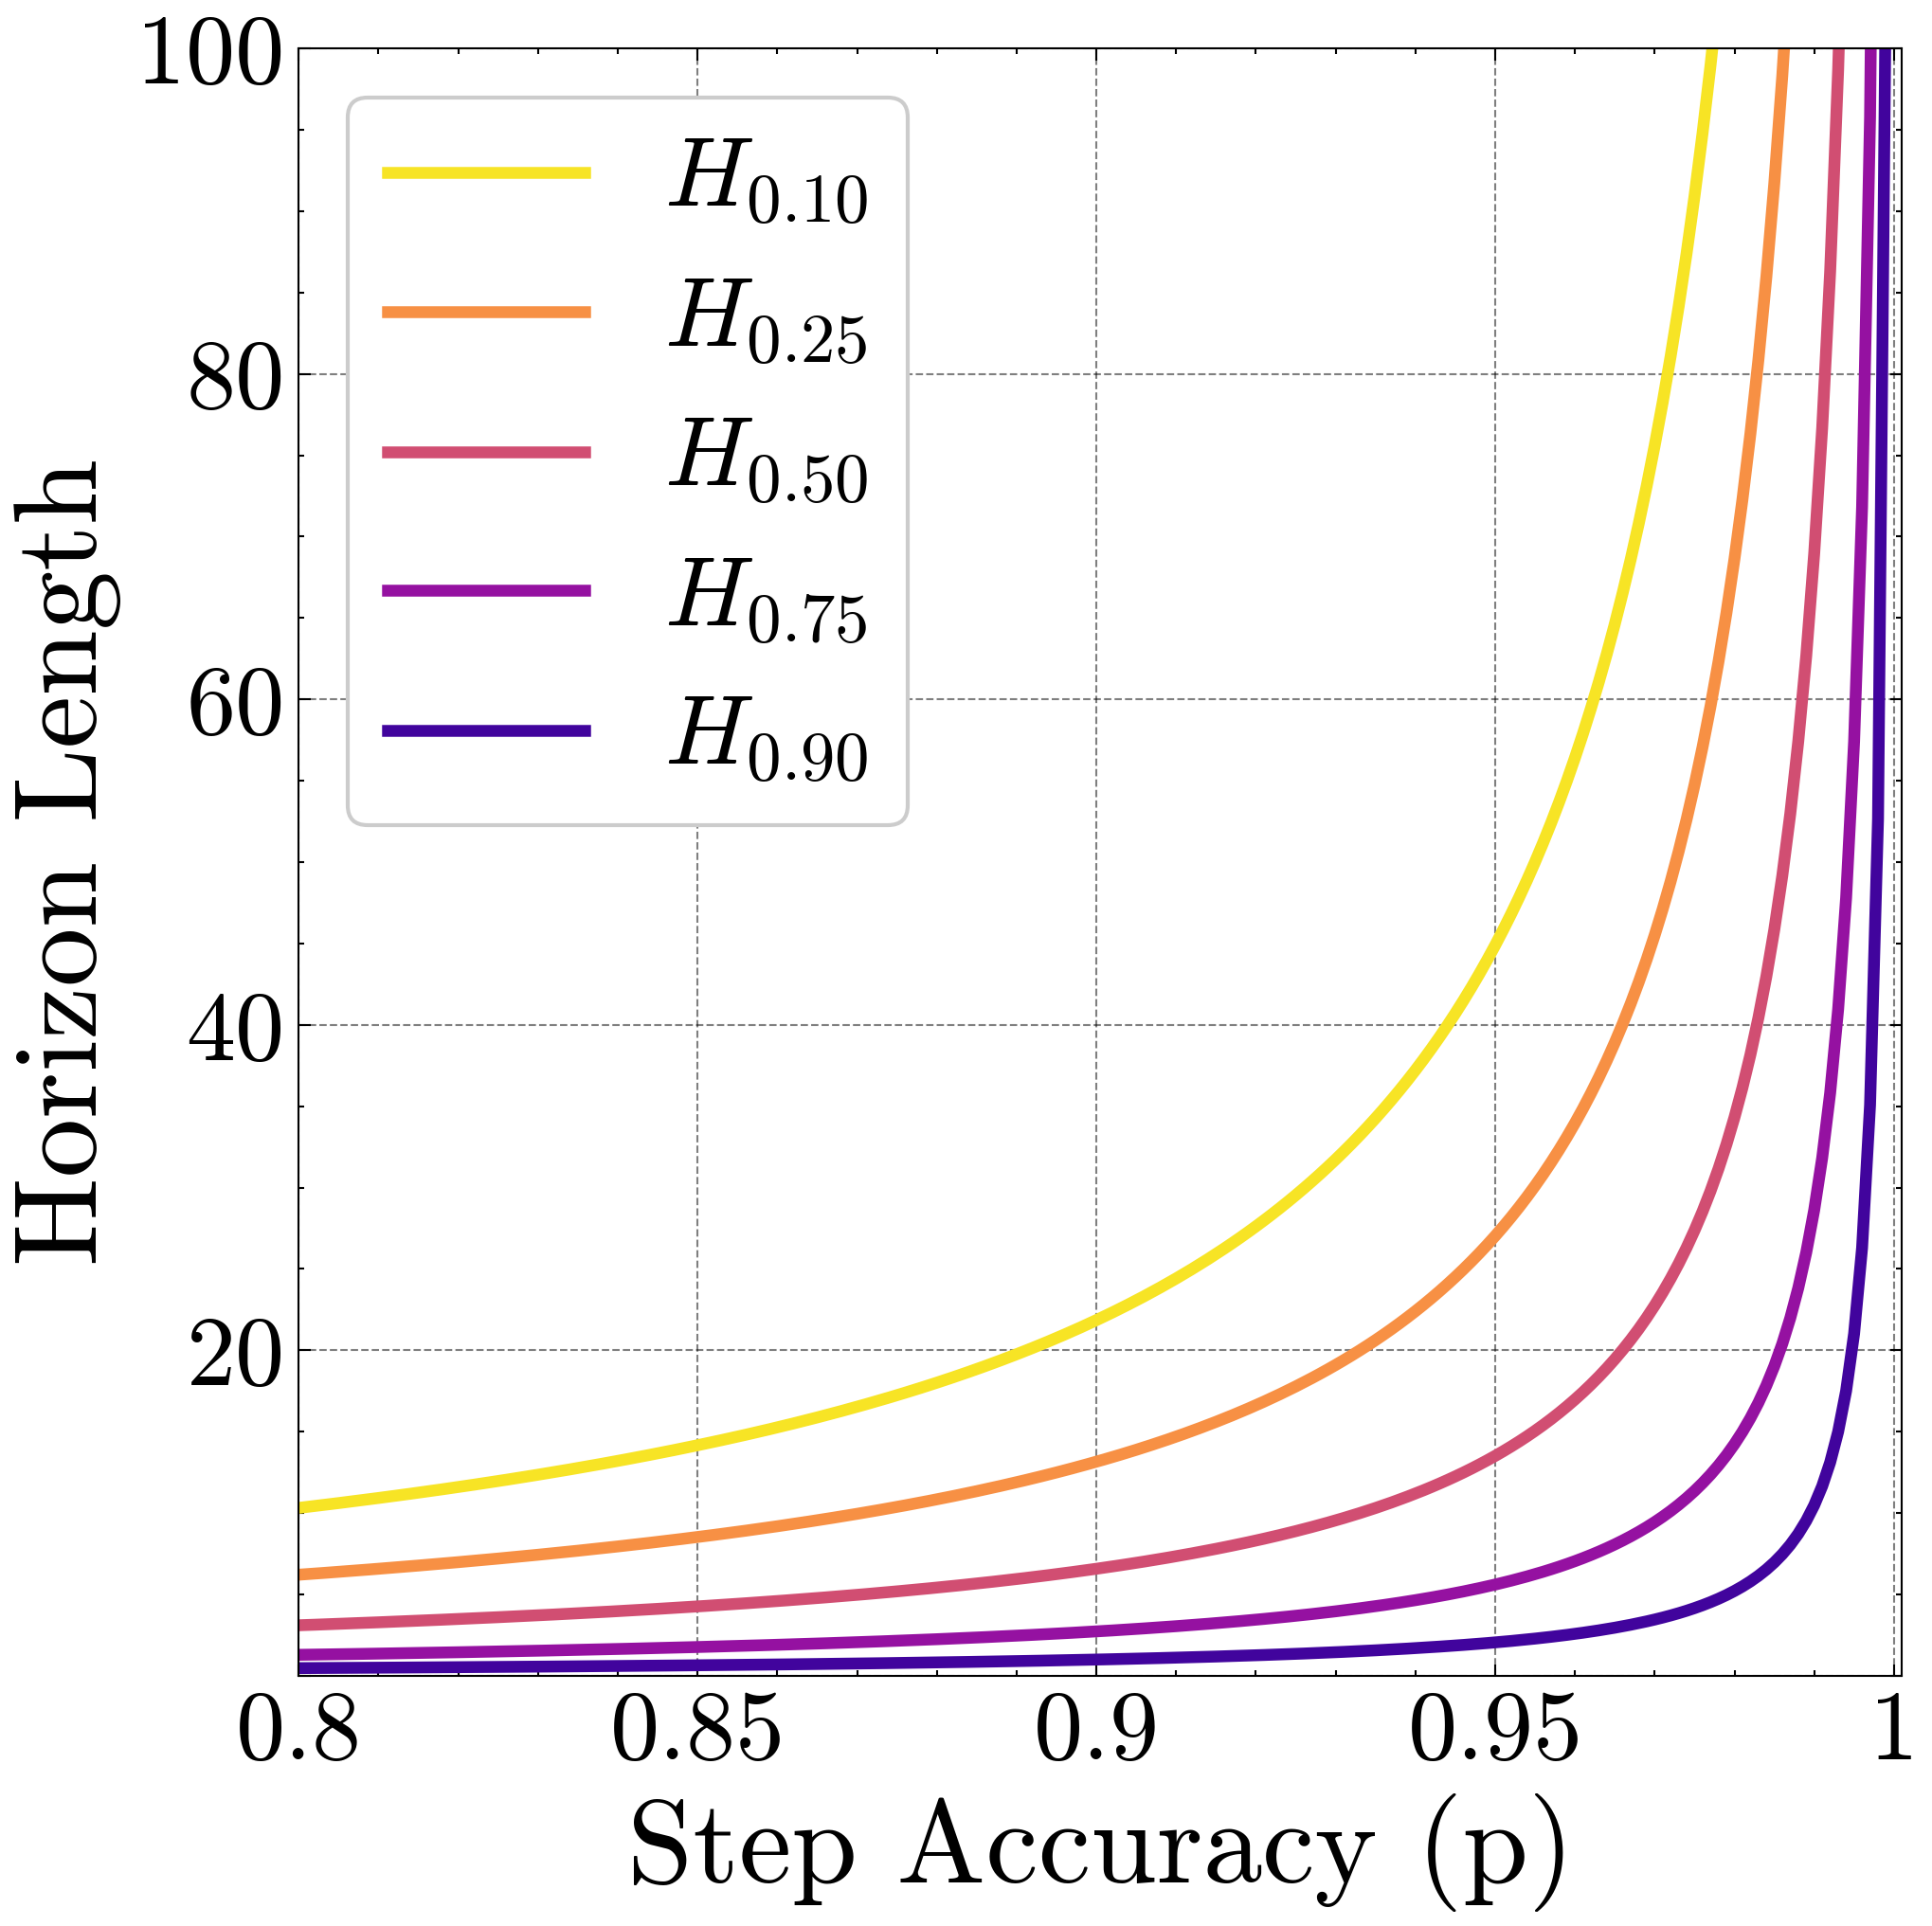
The image depicts a line chart illustrating the relationship between **Step Accuracy (p)** and **Horizon Length** across five distinct parameter values (H). The chart uses color-coded curves to represent different H values, with a legend in the top-left corner for reference.
---
### **Axis Labels and Scales**
- **X-Axis (Horizontal):**
- Title: **Step Accuracy (p)**
- Range: **0.8** to **1**
- Tick Marks: **0.8, 0.85, 0.9, 0.95, 1**
- Scale: Linear
- **Y-Axis (Vertical):**
- Title: **Horizon Length**
- Range: **0** to **100**
- Tick Marks: **20, 40, 60, 80, 100**
- Scale: Linear
---
### **Legend**
- **Location:** Top-left corner (inside a gray box).
- **Labels and Colors:**
| H Value | Color |
|---------|------------|
| H₀.₁₀ | Yellow |
| H₀.₂₅ | Orange |
| H₀.₅₀ | Red |
| H₀.₇₅ | Purple |
| H₀.₉₀ | Dark Blue |
---
### **Data Series and Trends**
1. **H₀.₁₀ (Yellow Line):**
- **Trend:** Starts at ~10 Horizon Length when p=0.8, curves steeply upward, reaching ~95 at p=1.
- **Key Points:**
- p=0.8 → ~10
- p=0.9 → ~30
- p=0.95 → ~70
- p=1 → ~95
2. **H₀.₂₅ (Orange Line):**
- **Trend:** Starts at ~5 Horizon Length when p=0.8, curves upward, reaching ~85 at p=1.
- **Key Points:**
- p=0.8 → ~5
- p=0.9 → ~25
- p=0.95 → ~60
- p=1 → ~85
3. **H₀.₅₀ (Red Line):**
- **Trend:** Starts at ~2 Horizon Length when p=0.8, curves upward, reaching ~90 at p=1.
- **Key Points:**
- p=0.8 → ~2
- p=0.9 → ~15
- p=0.95 → ~50
- p=1 → ~90
4. **H₀.₇₅ (Purple Line):**
- **Trend:** Starts at ~1 Horizon Length when p=0.8, curves upward, reaching ~98 at p=1.
- **Key Points:**
- p=0.8 → ~1
- p=0.9 → ~10
- p=0.95 → ~75
- p=1 → ~98
5. **H₀.₉₀ (Dark Blue Line):**
- **Trend:** Nearly flat line starting at ~0.5 Horizon Length when p=0.8, rising sharply near p=1 to ~99.
- **Key Points:**
- p=0.8 → ~0.5
- p=0.9 → ~2
- p=0.95 → ~50
- p=1 → ~99
---
### **Key Observations**
- **Inverse Relationship:** Higher H values (e.g., H₀.₉₀) exhibit steeper curves, indicating rapid increases in Horizon Length as Step Accuracy approaches 1.
- **Convergence:** All lines converge near p=1, with Horizon Length approaching 100 for all H values.
- **Divergence:** Lower H values (e.g., H₀.₁₀) show gradual increases, while higher H values (e.g., H₀.₉₀) exhibit near-vertical rises.
---
### **Spatial Grounding**
- **Legend Placement:** Top-left corner (x=0.05, y=0.95 relative to chart boundaries).
- **Line Placement:**
- Yellow (H₀.₁₀): Topmost curve.
- Orange (H₀.₂₅): Second-highest curve.
- Red (H₀.₅₀): Third-highest curve.
- Purple (H₀.₇₅): Fourth-highest curve.
- Dark Blue (H₀.₉₀): Bottommost curve.
---
### **Conclusion**
The chart demonstrates that **Higher H values correlate with steeper increases in Horizon Length as Step Accuracy improves**. This suggests a parameter-dependent sensitivity in the modeled system, where higher H values amplify the relationship between accuracy and horizon length.