## Line Graph: Accuracy vs. Attack Ratio
### Overview
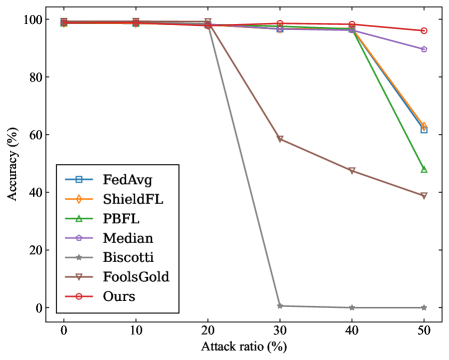
The image is a line graph comparing the accuracy of eight different methods (FedAvg, ShieldFL, PBFL, Median, Biscotti, FoolsGold, Ours) across varying attack ratios (0% to 50%). Accuracy is measured on the y-axis (0%–100%), while the x-axis represents attack ratio (0%–50%). Each method is represented by a distinct line with unique markers and colors, as indicated in the legend on the left.
### Components/Axes
- **Y-axis**: Accuracy (%)
- Scale: 0% to 100% in 20% increments.
- **X-axis**: Attack ratio (%)
- Scale: 0% to 50% in 10% increments.
- **Legend**:
- **FedAvg**: Blue squares (■)
- **ShieldFL**: Orange diamonds (◆)
- **PBFL**: Green triangles (▲)
- **Median**: Purple circles (●)
- **Biscotti**: Gray stars (★)
- **FoolsGold**: Brown triangles (▼)
- **Ours**: Red circles (○)
### Detailed Analysis
1. **FedAvg (Blue Squares)**:
- Starts at ~98% accuracy at 0% attack ratio.
- Declines gradually to ~62% at 50% attack ratio.
- Slope: Steady downward trend.
2. **ShieldFL (Orange Diamonds)**:
- Starts at ~99% accuracy at 0% attack ratio.
- Declines to ~64% at 50% attack ratio.
- Slope: Moderate downward trend.
3. **PBFL (Green Triangles)**:
- Starts at ~97% accuracy at 0% attack ratio.
- Declines sharply to ~48% at 50% attack ratio.
- Slope: Steep downward trend after 30% attack ratio.
4. **Median (Purple Circles)**:
- Starts at ~96% accuracy at 0% attack ratio.
- Declines slightly to ~90% at 50% attack ratio.
- Slope: Gentle downward trend.
5. **Biscotti (Gray Stars)**:
- Starts at ~99% accuracy at 0% attack ratio.
- Drops catastrophically to ~2% at 30% attack ratio.
- Slope: Vertical collapse at 30% attack ratio.
6. **FoolsGold (Brown Triangles)**:
- Starts at ~98% accuracy at 0% attack ratio.
- Declines to ~38% at 50% attack ratio.
- Slope: Gradual downward trend.
7. **Ours (Red Circles)**:
- Starts at ~99% accuracy at 0% attack ratio.
- Declines minimally to ~96% at 50% attack ratio.
- Slope: Near-flat trend.
### Key Observations
- **Robustness**: Methods like **Ours** and **Median** maintain high accuracy (>90%) even at 50% attack ratio, indicating strong resilience.
- **Vulnerability**: **Biscotti** collapses entirely at 30% attack ratio, suggesting extreme sensitivity.
- **Gradual Decline**: **FedAvg**, **ShieldFL**, and **FoolsGold** show moderate to steep declines, with **PBFL** being the most erratic (sharp drop after 30%).
- **Consistency**: **Ours** and **Median** exhibit the least variability across attack ratios.
### Interpretation
The graph demonstrates that **Ours** and **Median** are the most robust methods, maintaining near-100% accuracy even under high attack ratios. **Biscotti** is the least resilient, failing catastrophically at 30% attack ratio. The performance of **PBFL** and **FoolsGold** suggests they may lack adaptive mechanisms to handle adversarial attacks effectively. The data implies that methods with built-in adversarial defenses (e.g., **Ours**) outperform traditional approaches like **FedAvg** and **ShieldFL** in hostile environments. The sharp decline of **Biscotti** highlights the importance of attack-aware design in federated learning systems.