\n
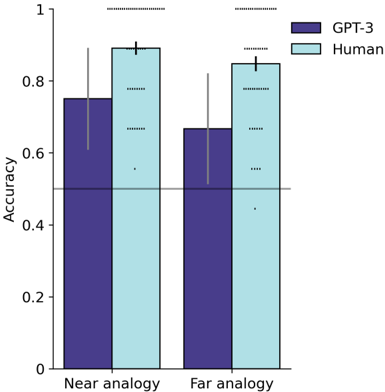
## Bar Chart: Accuracy of GPT-3 and Humans on Analogy Tasks
### Overview
This bar chart compares the accuracy of GPT-3 and human performance on two types of analogy tasks: "Near analogy" and "Far analogy". Accuracy is represented on the y-axis, and the type of analogy is on the x-axis. Each analogy type has two bars representing GPT-3 and Human performance. Error bars are included for each bar. Statistical significance is indicated by dots above the bars.
### Components/Axes
* **X-axis:** "Near analogy" and "Far analogy"
* **Y-axis:** "Accuracy", ranging from 0 to 1.
* **Legend:**
* Dark Blue: "GPT-3"
* Light Blue: "Human"
* **Error Bars:** Represent the variability or confidence interval around each accuracy score.
* **Statistical Significance Markers:** Dots above the bars indicate statistical significance. The number of dots likely corresponds to the p-value.
### Detailed Analysis
**Near Analogy:**
* **GPT-3:** The dark blue bar for "Near analogy" starts at approximately 0.77 and extends to approximately 0.81. There is a dot above the bar indicating statistical significance.
* **Human:** The light blue bar for "Near analogy" starts at approximately 0.87 and extends to approximately 0.92. There is a dot above the bar indicating statistical significance.
**Far Analogy:**
* **GPT-3:** The dark blue bar for "Far analogy" starts at approximately 0.65 and extends to approximately 0.69. There is a dot above the bar indicating statistical significance.
* **Human:** The light blue bar for "Far analogy" starts at approximately 0.85 and extends to approximately 0.90. There is a dot above the bar indicating statistical significance.
**Horizontal Line:** A horizontal line is present at approximately y = 0.55.
### Key Observations
* Humans consistently outperform GPT-3 on both "Near analogy" and "Far analogy" tasks.
* The difference in performance is more pronounced for "Far analogy" tasks.
* Both GPT-3 and humans show statistically significant performance on both analogy types, as indicated by the dots above the bars.
* The error bars suggest that the human performance is more consistent than GPT-3's performance.
### Interpretation
The data suggests that while GPT-3 can perform analogy tasks with some degree of accuracy, it lags behind human performance, particularly when the analogies are more complex ("Far analogy"). The consistent outperformance of humans indicates a qualitative difference in how humans and GPT-3 approach and solve analogy problems. This could be due to humans' superior ability to leverage common sense reasoning, contextual understanding, and abstract thought – capabilities that are still challenging for large language models like GPT-3. The statistical significance markers confirm that the observed differences are not likely due to chance. The horizontal line at 0.55 may represent a baseline or chance-level performance, highlighting that both models perform significantly above this level. The error bars indicate the variability in performance, suggesting that human performance is more reliable than GPT-3's.