## Grouped Bar Chart: Analogy Accuracy Comparison (GPT-3 vs. Human)
### Overview
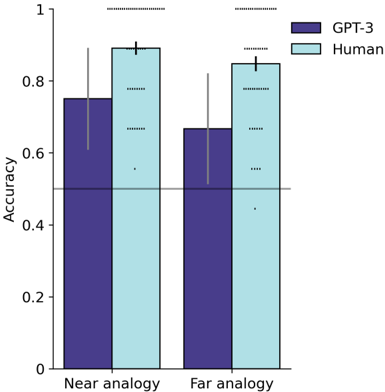
The image is a grouped bar chart comparing the accuracy of two entities—GPT-3 and Human—on two types of analogy tasks: "Near analogy" and "Far analogy." The chart includes error bars for each data point and a horizontal reference line at the 0.5 accuracy level.
### Components/Axes
* **Chart Type:** Grouped bar chart with error bars.
* **Y-Axis:**
* **Label:** "Accuracy"
* **Scale:** Linear, ranging from 0 to 1, with major tick marks at 0, 0.2, 0.4, 0.6, 0.8, and 1.
* **X-Axis:**
* **Categories:** Two primary categories: "Near analogy" (left group) and "Far analogy" (right group).
* **Legend:**
* **Position:** Top-right corner of the chart area.
* **Labels & Colors:**
* **GPT-3:** Represented by dark purple bars.
* **Human:** Represented by light blue bars.
* **Reference Line:** A solid horizontal line at y = 0.5, spanning the width of the chart.
* **Error Bars:** Vertical lines extending above and below the top of each bar, indicating variability or confidence intervals.
### Detailed Analysis
**1. Near Analogy Category (Left Group):**
* **GPT-3 (Dark Purple Bar):**
* **Visual Trend:** The bar is shorter than the adjacent Human bar.
* **Approximate Value:** The top of the bar aligns with an accuracy of approximately **0.75**.
* **Error Bar:** Extends from approximately **0.60** to **0.90**.
* **Human (Light Blue Bar):**
* **Visual Trend:** The bar is taller than the adjacent GPT-3 bar.
* **Approximate Value:** The top of the bar aligns with an accuracy of approximately **0.90**.
* **Error Bar:** Extends from approximately **0.85** to **0.95**.
**2. Far Analogy Category (Right Group):**
* **GPT-3 (Dark Purple Bar):**
* **Visual Trend:** The bar is shorter than the adjacent Human bar and also shorter than the GPT-3 bar in the "Near analogy" category.
* **Approximate Value:** The top of the bar aligns with an accuracy of approximately **0.65**.
* **Error Bar:** Extends from approximately **0.50** to **0.80**.
* **Human (Light Blue Bar):**
* **Visual Trend:** The bar is taller than the adjacent GPT-3 bar but slightly shorter than the Human bar in the "Near analogy" category.
* **Approximate Value:** The top of the bar aligns with an accuracy of approximately **0.85**.
* **Error Bar:** Extends from approximately **0.78** to **0.92**.
### Key Observations
1. **Performance Gap:** Human accuracy is higher than GPT-3 accuracy in both analogy categories.
2. **Task Difficulty:** Accuracy for both entities is lower on "Far analogy" tasks compared to "Near analogy" tasks.
3. **Relative Decline:** The performance drop from "Near" to "Far" analogy is more pronounced for GPT-3 (from ~0.75 to ~0.65, a drop of ~0.10) than for Humans (from ~0.90 to ~0.85, a drop of ~0.05).
4. **Variability:** The error bars for GPT-3 are noticeably larger than those for Humans in both categories, suggesting greater variability or less consistency in GPT-3's performance.
5. **Baseline Comparison:** All four data points (both bars for both entities) are above the 0.5 reference line, indicating performance better than chance for all conditions.
### Interpretation
The data suggests a clear performance advantage for humans over GPT-3 in solving analogies, particularly for "far" analogies which likely require more abstract or distant relational reasoning. The smaller performance drop for humans indicates they are more robust to the increased difficulty of far analogies. The larger error bars for GPT-3 imply its performance is less stable or predictable across different analogy instances. The chart effectively communicates that while GPT-3 performs above chance, there remains a significant gap between its analogical reasoning capabilities and human-level performance, especially for more challenging, abstract tasks. The 0.5 line serves as a crucial benchmark, confirming that both entities are performing meaningfully above random guessing.