## Bar Chart: GPT-3 vs Human Accuracy in Analogy Tasks
### Overview
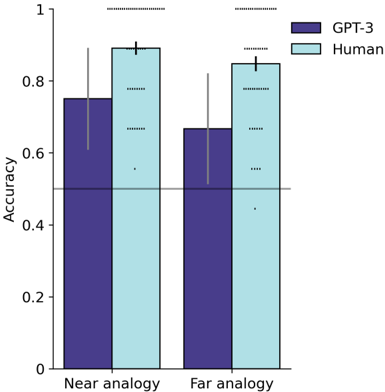
The chart compares the accuracy of GPT-3 and human performance in two analogy tasks: "Near analogy" and "Far analogy." Accuracy is measured on a scale from 0 to 1, with error bars indicating variability. GPT-3 is represented by purple bars, and human performance by light blue bars.
### Components/Axes
- **X-axis**: Task categories ("Near analogy," "Far analogy").
- **Y-axis**: Accuracy (0 to 1.0 in increments of 0.2).
- **Legend**: Located on the right, with GPT-3 (purple) and Human (light blue) labels.
- **Error bars**: Vertical lines with caps on top of each bar, indicating variability.
### Detailed Analysis
- **Near analogy**:
- GPT-3: Approximately 0.75 accuracy (error bars extend ~±0.05).
- Human: Approximately 0.9 accuracy (error bars extend ~±0.05).
- **Far analogy**:
- GPT-3: Approximately 0.65 accuracy (error bars extend ~±0.05).
- Human: Approximately 0.85 accuracy (error bars extend ~±0.05).
### Key Observations
1. Human accuracy exceeds GPT-3 in both tasks.
2. The performance gap is smaller in "Near analogy" (0.15 difference) than in "Far analogy" (0.20 difference).
3. Error bars overlap slightly in both categories, suggesting some uncertainty but consistent trends.
### Interpretation
The data demonstrates that humans outperform GPT-3 in analogy tasks, with a larger disparity in "Far analogy" tasks. This suggests GPT-3 struggles more with abstract or less obvious analogies. The error bars indicate variability in both human and model performance, but the directional trend (human > GPT-3) is robust. The results align with prior findings that large language models like GPT-3 excel in pattern recognition but face challenges in tasks requiring deeper conceptual understanding.