## Diagram: Fault Injection Framework for Machine Learning Models
### Overview
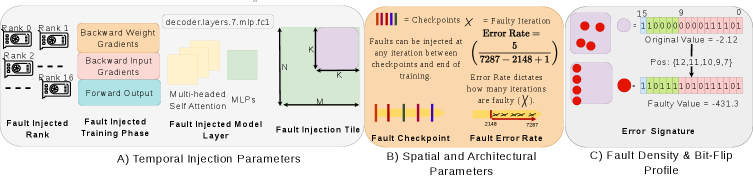
The diagram illustrates a technical framework for injecting faults into machine learning models during training. It is divided into three sections:
1. **Temporal Injection Parameters** (A)
2. **Spatial and Architectural Parameters** (B)
3. **Fault Density & Bit-Flip Profile** (C)
### Components/Axes
#### Section A: Temporal Injection Parameters
- **Labels**:
- "Fault Injected Rank" (leftmost column, labeled 0, 1, 2, ..., 16)
- "Backward Weight Gradients" (orange block)
- "Backward Input Gradients" (pink block)
- "Forward Output" (blue block)
- "Fault Injected Training Phase" (horizontal axis)
- "Multi-headed Self-Attention MLPs" (stacked yellow blocks)
- "Decoder.layers.7.mlp.fc1" (text annotation)
- **Flow**:
- Gradients (backward weight/input) and forward outputs are processed through multi-headed self-attention layers.
- Fault injection occurs at specific ranks during training phases.
#### Section B: Spatial and Architectural Parameters
- **Labels**:
- "Fault Checkpoint" (vertical colored bars: red, green, blue, etc.)
- "Fault Error Rate" (formula: `Error Rate = 5 / (7287 - 2148 + 1)`)
- "Fault Injection Tile" (green rectangle with dimensions `N`, `K`, `M`)
- **Flow**:
- Faults are injected between checkpoints during training iterations.
- Error rate determines the number of faulty iterations (5 in this case).
#### Section C: Fault Density & Bit-Flip Profile
- **Labels**:
- "Original Value" (-2.12)
- "Faulty Value" (-431.3)
- "Error Signature" (sequence of 1s and 0s with red dots)
- "Pos: {12, 11, 10, 9, 7}" (bit positions flipped)
- **Flow**:
- Bit-flips at specific positions alter the original value to a faulty value.
### Detailed Analysis
#### Section A
- **Fault Injected Rank**: Ranks 0–16 are shown with dashed lines, indicating multiple injection points.
- **Gradients**: Backward weight and input gradients are distinct blocks, suggesting separate processing paths.
- **Multi-headed Self-Attention**: Stacked layers imply hierarchical processing of gradients and outputs.
#### Section B
- **Error Rate Calculation**:
- `7287 - 2148 + 1 = 5140`
- `Error Rate = 5 / 5140 ≈ 0.0009727` (≈0.0973%).
- **Checkpoints**: Colored bars (red, green, blue) represent intervals between which faults are injected.
#### Section C
- **Bit-Flip Impact**:
- Original value: -2.12 (binary: `110000000000111101`).
- Faulty value: -431.3 (binary: `1101110101011101101`).
- Flipped bits at positions 12, 11, 10, 9, 7 (highlighted in green).
### Key Observations
1. **Temporal Injection**: Faults are injected at specific ranks during training phases, affecting gradients and outputs.
2. **Spatial Parameters**: Checkpoints and error rates govern the frequency and scope of fault injection.
3. **Bit-Flip Profile**: A single bit-flip at position 12 causes a drastic change in the value (-2.12 → -431.3), indicating high sensitivity.
### Interpretation
- **Model Robustness**: The framework highlights how temporal and spatial parameters influence fault injection, critical for testing model resilience.
- **Error Propagation**: The drastic change in value from a single bit-flip suggests vulnerabilities in numerical stability.
- **Checkpoint Strategy**: Injecting faults between checkpoints allows controlled testing of recovery mechanisms.
- **Architectural Impact**: Multi-headed self-attention layers may distribute fault effects differently than simpler architectures.
This diagram provides a structured approach to analyzing fault injection in ML models, emphasizing the interplay between training dynamics, architectural design, and numerical stability.