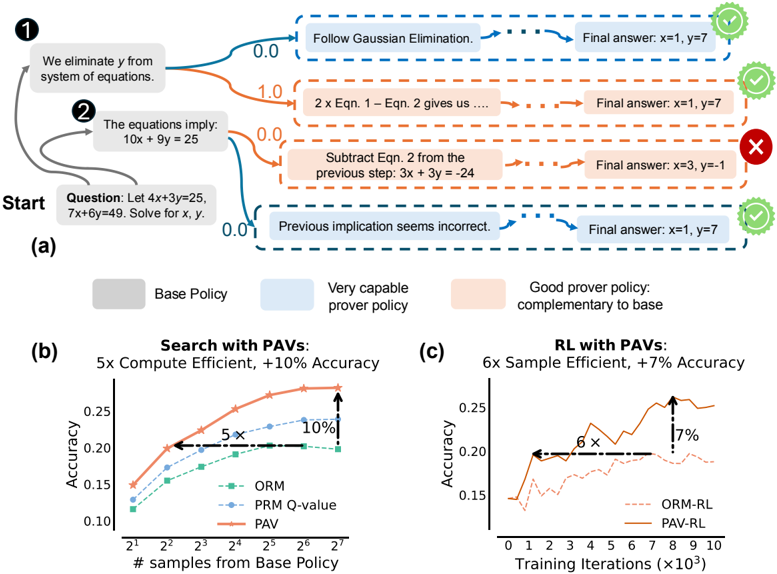
## Decision Tree and Performance Charts: PAVs
### Overview
The image presents a decision tree diagram illustrating a problem-solving process, alongside two line charts comparing the performance of different algorithms with and without PAVs (Potentially Advantageous Variants). The decision tree shows steps to solve a system of equations, while the charts compare accuracy versus computational effort or training iterations.
### Components/Axes
**Decision Tree (a):**
* **Nodes:** Represented by rounded rectangles containing text describing the current state or action.
* **Edges:** Arrows indicating the flow of the decision-making process.
* **Start Node:** Labeled "Start" with the initial question: "Let 4x+3y=25, 7x+6y=49. Solve for x, y."
* **Intermediate Nodes:** Describe steps like "We eliminate y from system of equations" and "The equations imply: 10x + 9y = 25".
* **Leaf Nodes:** Contain "Final answer: x=..., y=..." and are marked with either a green checkmark (correct) or a red "X" (incorrect).
* **Edge Labels:** Numerical values (0.0, 1.0) associated with certain edges.
* **Node Styles:** Nodes are filled with different colors: gray ("Base Policy"), light blue ("Very capable prover policy"), and light orange ("Good prover policy: complementary to base").
**Chart (b): Search with PAVs**
* **Title:** "Search with PAVs: 5x Compute Efficient, +10% Accuracy"
* **X-axis:** "# samples from Base Policy" with a logarithmic scale (2<sup>1</sup> to 2<sup>7</sup>).
* **Y-axis:** "Accuracy" ranging from 0.10 to 0.25.
* **Data Series:**
* ORM (green dashed line with square markers)
* PRM Q-value (blue dashed line with triangle markers)
* PAV (orange solid line with star markers)
* **Annotations:** "5x" and "+10%" indicating performance improvements.
**Chart (c): RL with PAVs**
* **Title:** "RL with PAVs: 6x Sample Efficient, +7% Accuracy"
* **X-axis:** "Training Iterations (×10<sup>3</sup>)" ranging from 0 to 10.
* **Y-axis:** "Accuracy" ranging from 0.15 to 0.25.
* **Data Series:**
* ORM-RL (brown dashed line)
* PAV-RL (dark orange solid line)
* **Annotations:** "6x" and "+7%" indicating performance improvements.
### Detailed Analysis
**Decision Tree (a):**
* The tree starts with the question and branches into two initial steps.
* The first branch ("We eliminate y from system of equations") leads to "Follow Gaussian Elimination" (blue node) and a correct final answer (x=1, y=7).
* The second branch ("The equations imply: 10x + 9y = 25") splits into two paths.
* One path ("2 x Eqn. 1 - Eqn. 2 gives us...") leads to a correct final answer (x=1, y=7).
* The other path ("Subtract Eqn. 2 from the previous step: 3x + 3y = -24") leads to an incorrect final answer (x=3, y=-1).
* A final branch from the initial question ("Previous implication seems incorrect.") leads to a correct final answer (x=1, y=7).
**Chart (b): Search with PAVs**
* **ORM:** Starts at approximately 0.12 accuracy and increases to approximately 0.20 accuracy.
* **PRM Q-value:** Starts at approximately 0.15 accuracy and increases to approximately 0.22 accuracy.
* **PAV:** Starts at approximately 0.14 accuracy and increases to approximately 0.27 accuracy.
* The PAV line consistently outperforms the other two.
* The "5x Compute Efficient" annotation indicates that PAV achieves a certain accuracy level with 5 times fewer samples than another method (likely ORM or PRM Q-value).
* The "+10% Accuracy" annotation indicates that PAV achieves 10% higher accuracy than another method at a certain sample size.
**Chart (c): RL with PAVs**
* **ORM-RL:** Starts at approximately 0.15 accuracy and fluctuates, ending around 0.20 accuracy.
* **PAV-RL:** Starts at approximately 0.20 accuracy and increases to approximately 0.26 accuracy.
* The PAV-RL line consistently outperforms the ORM-RL line.
* The "6x Sample Efficient" annotation indicates that PAV-RL achieves a certain accuracy level with 6 times fewer training iterations than ORM-RL.
* The "+7% Accuracy" annotation indicates that PAV-RL achieves 7% higher accuracy than ORM-RL at a certain number of training iterations.
### Key Observations
* The decision tree illustrates different approaches to solving a system of equations, with varying degrees of success.
* The charts demonstrate that using PAVs improves both computational efficiency and accuracy in both search and reinforcement learning contexts.
* In both charts, the PAV-based methods (PAV and PAV-RL) consistently outperform their counterparts (ORM and ORM-RL).
### Interpretation
The data suggests that incorporating Potentially Advantageous Variants (PAVs) into algorithms can significantly enhance their performance. The decision tree highlights the importance of choosing the correct steps in problem-solving, as some paths lead to incorrect solutions. The charts quantify the benefits of PAVs, showing that they can lead to substantial improvements in both computational efficiency and accuracy. This implies that PAVs are a valuable technique for optimizing algorithms in various domains. The "5x", "6x", "+10%", and "+7%" annotations provide concrete evidence of the performance gains achieved by using PAVs.