## Radar Chart: Comparison of Average Scores per Dimension (EN vs. CN)
### Overview
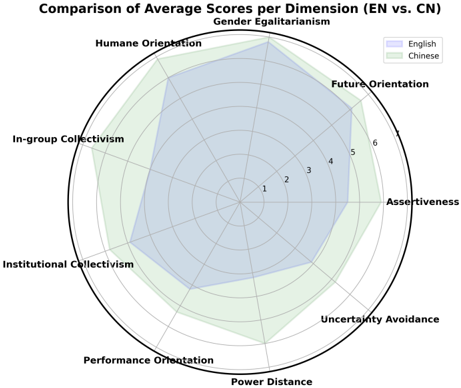
This is a radar chart (or spider chart) comparing the average scores of two groups, labeled "English" and "Chinese," across nine distinct cultural or psychological dimensions. The chart visualizes the relative strengths and profiles of each group on a common scale.
### Components/Axes
* **Chart Title:** "Comparison of Average Scores per Dimension (EN vs. CN)" (Top center).
* **Legend:** Located in the top-right corner.
* **English:** Represented by a light blue, semi-transparent filled area.
* **Chinese:** Represented by a light green, semi-transparent filled area.
* **Axes (Dimensions):** Nine axes radiate from the center, each labeled with a dimension name. The labels are positioned at the outer end of each axis. Clockwise from the top:
1. Gender Egalitarianism
2. Future Orientation
3. Assertiveness
4. Uncertainty Avoidance
5. Power Distance
6. Performance Orientation
7. Institutional Collectivism
8. In-group Collectivism
9. Humane Orientation
* **Scale:** Concentric circles represent the scoring scale, marked with numbers from the center outward: 1, 2, 3, 4, 5, 6. The outermost circle represents a score of 6.
### Detailed Analysis
**Trend Verification & Data Point Extraction:**
The English (blue) profile is generally more centralized and balanced, while the Chinese (green) profile shows more pronounced peaks and valleys.
1. **Gender Egalitarianism:**
* *Trend:* English scores higher than Chinese.
* *English (Blue):* Approximately 4.5.
* *Chinese (Green):* Approximately 3.5.
2. **Future Orientation:**
* *Trend:* English scores notably higher; this is one of the highest points for the English profile.
* *English (Blue):* Approximately 5.5.
* *Chinese (Green):* Approximately 4.5.
3. **Assertiveness:**
* *Trend:* English scores moderately higher.
* *English (Blue):* Approximately 4.0.
* *Chinese (Green):* Approximately 3.0.
4. **Uncertainty Avoidance:**
* *Trend:* English scores higher.
* *English (Blue):* Approximately 5.0.
* *Chinese (Green):* Approximately 4.0.
5. **Power Distance:**
* *Trend:* Chinese scores significantly higher; this is a major peak for the Chinese profile and a low point for English.
* *English (Blue):* Approximately 2.0.
* *Chinese (Green):* Approximately 4.0.
6. **Performance Orientation:**
* *Trend:* English scores higher.
* *English (Blue):* Approximately 4.5.
* *Chinese (Green):* Approximately 3.5.
7. **Institutional Collectivism:**
* *Trend:* Chinese scores substantially higher.
* *English (Blue):* Approximately 3.0.
* *Chinese (Green):* Approximately 5.0.
8. **In-group Collectivism:**
* *Trend:* Chinese scores very high; this is the highest point for the Chinese profile. English scores its lowest here.
* *English (Blue):* Approximately 2.5.
* *Chinese (Green):* Approximately 5.5.
9. **Humane Orientation:**
* *Trend:* English scores moderately higher.
* *English (Blue):* Approximately 4.0.
* *Chinese (Green):* Approximately 3.0.
### Key Observations
* **Divergent Peaks:** The profiles peak on almost opposite sides of the chart. The English profile peaks in **Future Orientation** and **Uncertainty Avoidance**. The Chinese profile peaks dramatically in **In-group Collectivism** and **Institutional Collectivism**.
* **Power Distance Contrast:** This dimension shows one of the largest gaps, with Chinese culture scoring about twice as high as English culture.
* **Collectivism vs. Individualism:** The chart strongly suggests a contrast between a more individualistic orientation (English, with low scores on collectivism dimensions) and a more collectivistic orientation (Chinese, with high scores on collectivism dimensions).
* **Shape Analysis:** The English (blue) shape is more compact and centered, suggesting a more balanced profile across these specific dimensions. The Chinese (green) shape is more elongated and skewed towards the collectivism and power distance axes.
### Interpretation
This radar chart provides a visual summary of cultural dimension scores, likely based on a framework such as the GLOBE project or similar cross-cultural research. The data suggests fundamental differences in cultural priorities between the groups labeled "English" (likely representing an Anglo cultural cluster) and "Chinese."
The **English** profile indicates a culture that places higher value on planning for the future, tolerating ambiguity, and achieving performance, while maintaining lower acceptance of hierarchical power structures and strong in-group favoritism. This aligns with common characterizations of individualistic societies.
The **Chinese** profile indicates a culture with a very strong emphasis on loyalty and cohesion within primary in-groups (family, close organization) and formal institutions, coupled with a higher acceptance of centralized power. The lower scores on future orientation and uncertainty avoidance (relative to the English group) could suggest a different approach to planning and risk, potentially more adaptive or context-dependent.
The most significant takeaway is the stark contrast on the **collectivism** and **power distance** axes, which are often considered core differentiating factors in cross-cultural studies. The chart effectively communicates that these two groups have developed distinct cultural "shapes" with different strengths and focal points.