## Line Chart: Model Performance Comparison Across Datasets
### Overview
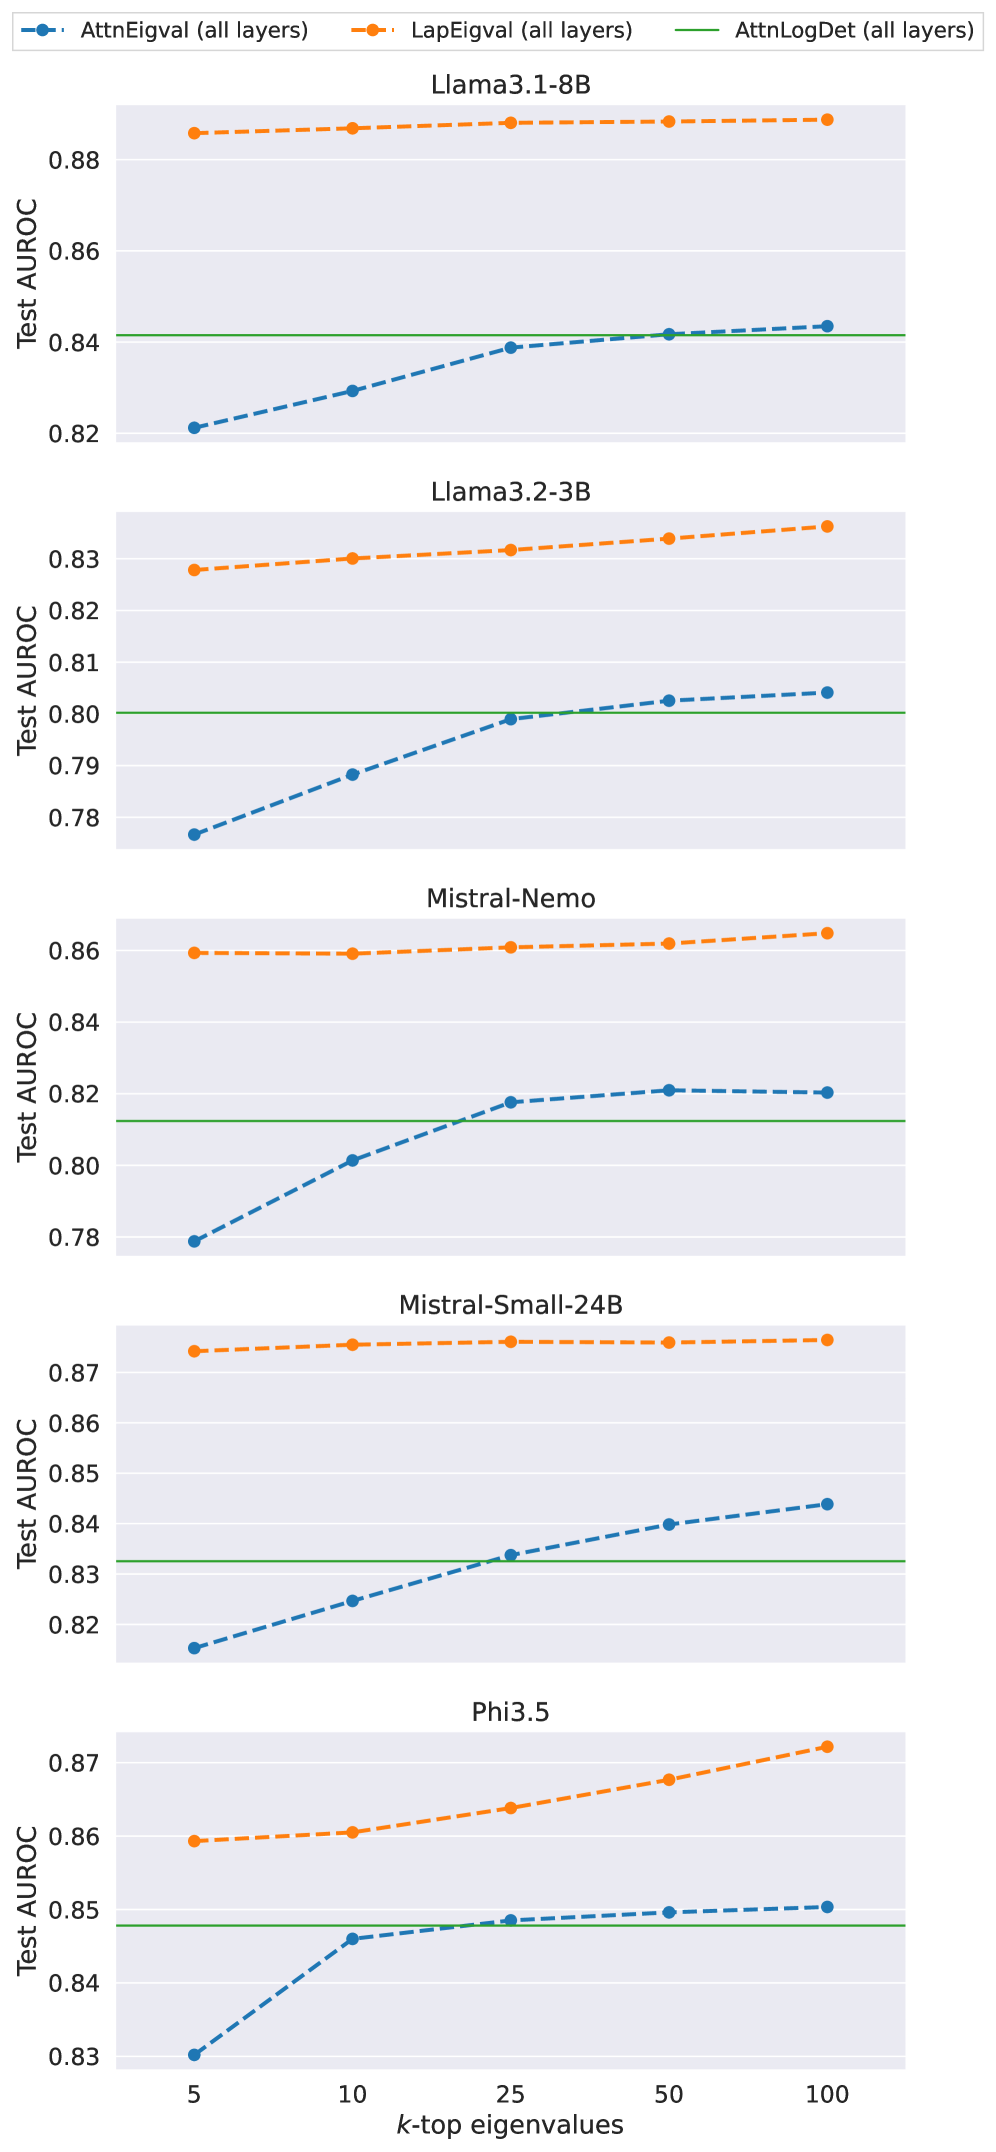
The image is a multi-panel line chart comparing the performance of three model evaluation methods (AttnEigval, LapEigval, AttnLogDet) across five datasets (Llam3.1-8B, Llam3.2-3B, Mistral-Nemo, Mistral-Small-24B, Phi3.5). Performance is measured by Test AUROC (Area Under the ROC Curve), with k-top eigenvalues (5, 10, 25, 50, 100) as the independent variable. A green reference line at AUROC=0.84 is included for benchmarking.
---
### Components/Axes
- **X-axis**: k-top eigenvalues (5, 10, 25, 50, 100)
- **Y-axis**: Test AUROC (ranging from ~0.78 to 0.88)
- **Legend**:
- Blue dashed line: AttnEigval (all layers)
- Orange dash-dot line: LapEigval (all layers)
- Green solid line: AttnLogDet (all layers)
- **Panels**: Five subplots labeled with dataset names (top to bottom: Llam3.1-8B, Llam3.2-3B, Mistral-Nemo, Mistral-Small-24B, Phi3.5).
---
### Detailed Analysis
#### Llam3.1-8B
- **AttnEigval**: Starts at ~0.822 (k=5), increases to ~0.843 (k=100).
- **LapEigval**: Flat at ~0.885 across all k-values.
- **AttnLogDet**: Horizontal at 0.84.
#### Llam3.2-3B
- **AttnEigval**: Starts at ~0.778 (k=5), rises to ~0.802 (k=100).
- **LapEigval**: Flat at ~0.832 across all k-values.
- **AttnLogDet**: Horizontal at 0.80.
#### Mistral-Nemo
- **AttnEigval**: Starts at ~0.78 (k=5), increases to ~0.822 (k=100).
- **LapEigval**: Flat at ~0.86 across all k-values.
- **AttnLogDet**: Horizontal at 0.82.
#### Mistral-Small-24B
- **AttnEigval**: Starts at ~0.818 (k=5), rises to ~0.845 (k=100).
- **LapEigval**: Flat at ~0.87 across all k-values.
- **AttnLogDet**: Horizontal at 0.83.
#### Phi3.5
- **AttnEigval**: Starts at ~0.83 (k=5), increases to ~0.852 (k=100).
- **LapEigval**: Flat at ~0.865 across all k-values.
- **AttnLogDet**: Horizontal at 0.85.
---
### Key Observations
1. **LapEigval Dominance**: Consistently achieves the highest AUROC across all datasets, with minimal variation as k increases.
2. **AttnEigval Trends**: Performance improves with larger k-values, approaching or surpassing the AttnLogDet baseline in larger models (e.g., Mistral-Small-24B, Phi3.5).
3. **AttnLogDet as Baseline**: Acts as a fixed reference point, with values ranging from 0.80 (Llam3.2-3B) to 0.85 (Phi3.5).
4. **Dataset Variability**: Larger models (e.g., Mistral-Small-24B, Phi3.5) show higher baseline AUROC values compared to smaller models (e.g., Llam3.2-3B).
---
### Interpretation
- **Model Robustness**: LapEigval’s stability suggests it is less sensitive to eigenvalue selection, making it a reliable choice for model evaluation.
- **AttnEigval Sensitivity**: Its performance gains with larger k-values indicate it captures more nuanced layer interactions but may overfit smaller datasets (e.g., Llam3.2-3B).
- **AttnLogDet as Benchmark**: The green line provides a clear threshold for evaluating whether eigenvalue-based methods outperform simpler baselines.
- **Dataset Complexity**: Larger models (e.g., Mistral-Small-24B) exhibit higher AUROC values, implying they may have more discriminative features for evaluation.
The data suggests that LapEigval is the most robust method across datasets, while AttnEigval’s performance depends on the number of eigenvalues considered. AttnLogDet serves as a critical baseline, with its value correlating with model size (e.g., higher for Phi3.5 than Llam3.2-3B).