## Line Chart: Enhancing Weaknesses
### Overview
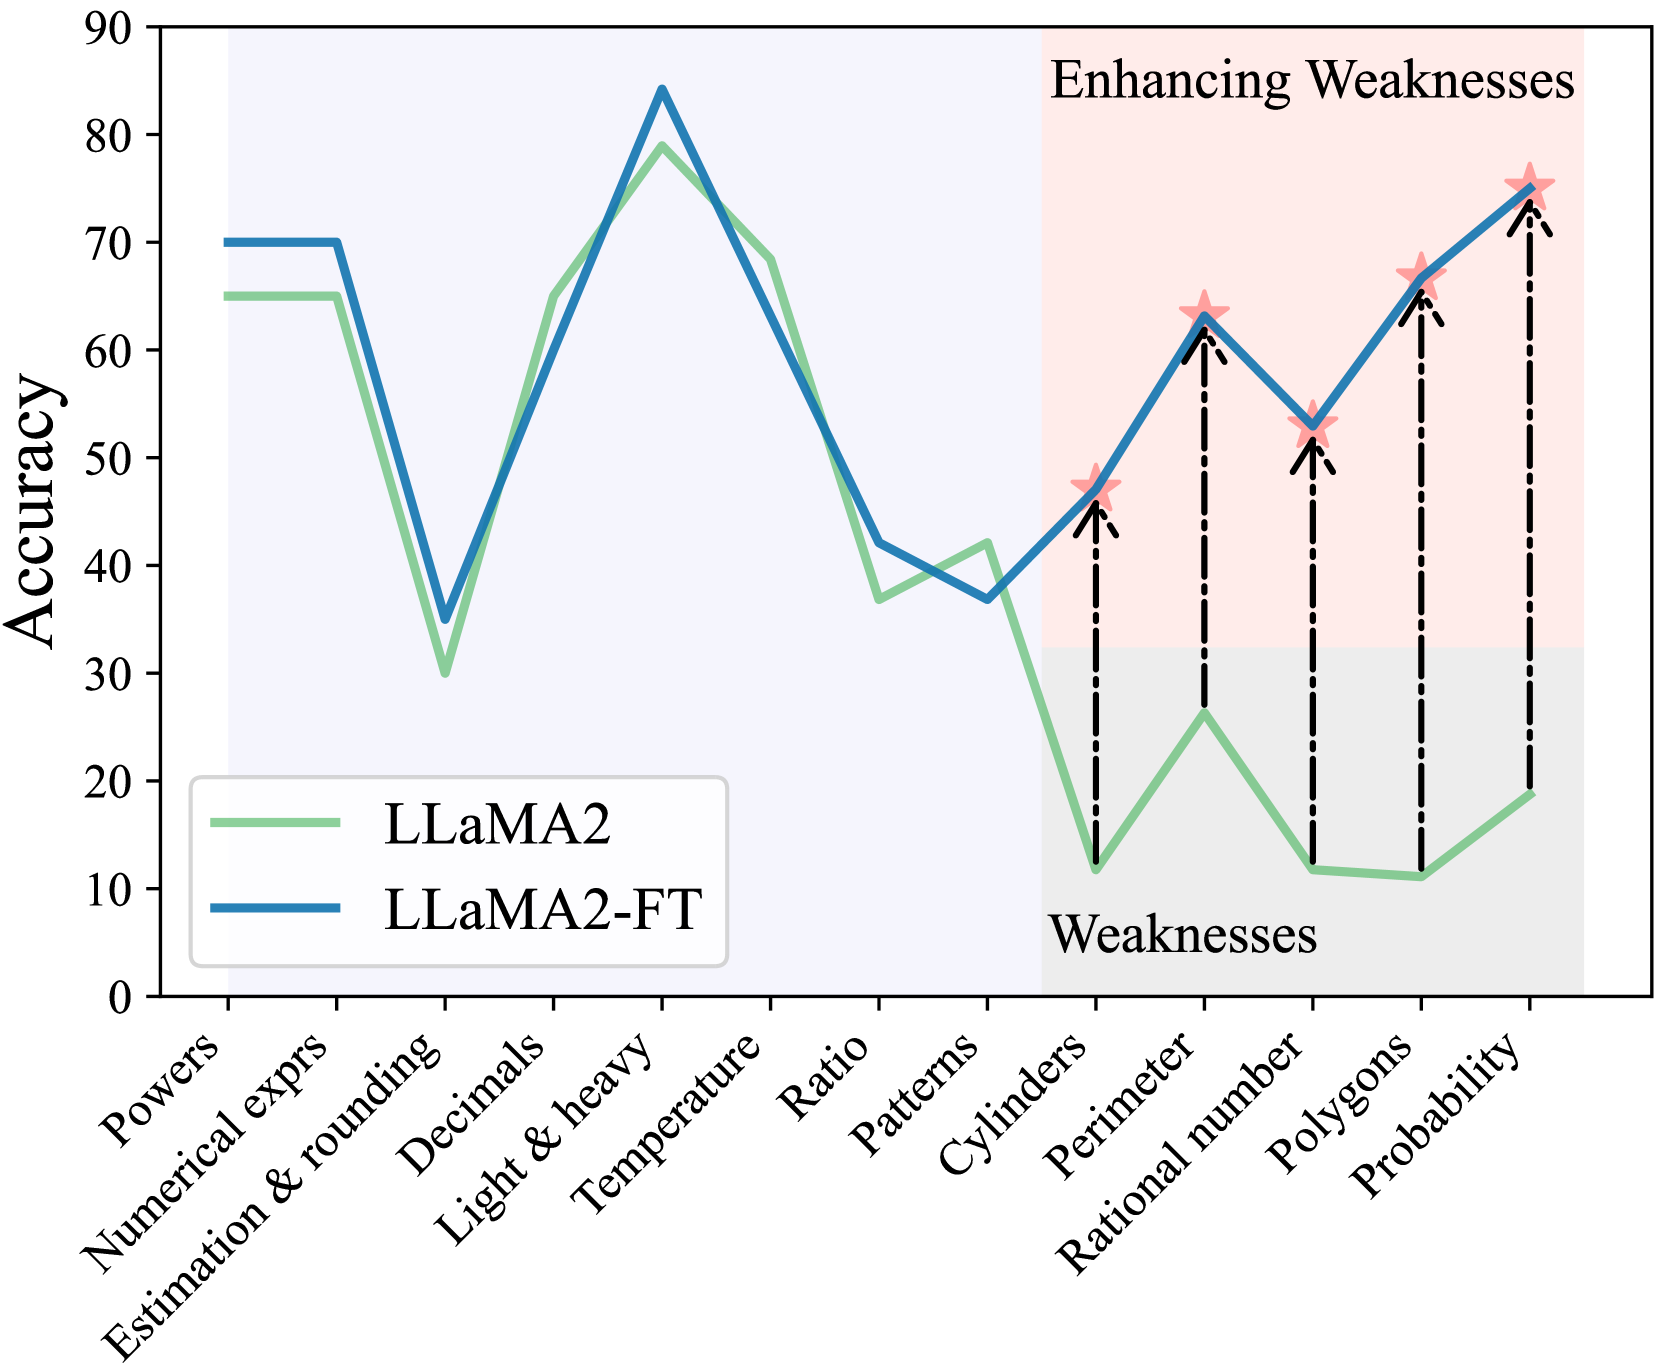
This line chart compares the accuracy of two language models, LLaMA2 and LLaMA2-FT, across a range of mathematical and logical reasoning tasks identified as "Weaknesses". The chart displays accuracy on the y-axis against different task categories on the x-axis. The chart aims to demonstrate the impact of fine-tuning (FT) on improving performance in areas where the base model (LLaMA2) struggles.
### Components/Axes
* **Title:** "Enhancing Weaknesses" (top-center)
* **X-axis Label:** Task Categories (bottom-center)
* Categories: "Powers", "Numerical exprs", "Estimation & rounding", "Decimals", "Light & heavy", "Temperature", "Ratio", "Patterns", "Cylinders", "Perimeter", "Rational number", "Polygons", "Probability"
* **Y-axis Label:** "Accuracy" (left-center), ranging from 0 to 90.
* **Legend:** (bottom-left)
* Light Green Line: "LLaMA2"
* Dark Blue Line: "LLaMA2-FT"
### Detailed Analysis
The chart presents two lines representing the accuracy of each model across the listed task categories.
**LLaMA2 (Light Green Line):**
* **Trend:** The line fluctuates significantly. It starts at approximately 70 accuracy for "Powers", dips to around 20 for "Numerical exprs", rises to approximately 70 for "Estimation & rounding", then falls to around 50 for "Decimals". It peaks at approximately 85 for "Temperature", drops to around 60 for "Ratio", then declines to a low of approximately 10 for "Patterns". It then rises to approximately 60 for "Cylinders", falls to approximately 40 for "Perimeter", rises to approximately 60 for "Rational number", then rises to approximately 75 for "Polygons", and finally falls to approximately 15 for "Probability".
* **Data Points (approximate):**
* Powers: 70
* Numerical exprs: 20
* Estimation & rounding: 70
* Decimals: 50
* Light & heavy: 60
* Temperature: 85
* Ratio: 60
* Patterns: 10
* Cylinders: 60
* Perimeter: 40
* Rational number: 60
* Polygons: 75
* Probability: 15
**LLaMA2-FT (Dark Blue Line):**
* **Trend:** This line also fluctuates, but generally maintains higher accuracy than LLaMA2, especially in the "Weaknesses" categories. It starts at approximately 65 for "Powers", dips to around 30 for "Numerical exprs", rises to approximately 65 for "Estimation & rounding", then falls to around 40 for "Decimals". It peaks at approximately 80 for "Temperature", drops to around 50 for "Ratio", then rises to approximately 65 for "Patterns". It then rises to approximately 70 for "Cylinders", falls to approximately 55 for "Perimeter", rises to approximately 65 for "Rational number", then rises to approximately 75 for "Polygons", and finally rises to approximately 70 for "Probability".
* **Data Points (approximate):**
* Powers: 65
* Numerical exprs: 30
* Estimation & rounding: 65
* Decimals: 40
* Light & heavy: 55
* Temperature: 80
* Ratio: 50
* Patterns: 65
* Cylinders: 70
* Perimeter: 55
* Rational number: 65
* Polygons: 75
* Probability: 70
### Key Observations
* LLaMA2-FT consistently outperforms LLaMA2 across all categories.
* Both models exhibit the lowest accuracy on "Patterns" and "Probability".
* The largest performance gains from fine-tuning are observed in "Patterns", "Cylinders", "Polygons", and "Probability".
* "Temperature" is the category where both models achieve their highest accuracy.
* The gap between the two models is most pronounced in the "Weaknesses" categories (Patterns, Cylinders, Perimeter, Rational number, Polygons, Probability).
### Interpretation
The chart demonstrates that fine-tuning (LLaMA2-FT) significantly improves the accuracy of the LLaMA2 model, particularly in areas where the base model struggles. The tasks categorized as "Weaknesses" show the most substantial gains from fine-tuning, suggesting that the fine-tuning process effectively addresses these specific challenges. The consistent outperformance of LLaMA2-FT indicates that the fine-tuning data and methodology were successful in enhancing the model's reasoning capabilities. The low accuracy scores for "Patterns" and "Probability" for both models suggest these areas remain challenging for the model, even after fine-tuning, and may require further investigation or specialized training. The high accuracy on "Temperature" could be due to the relative simplicity of this task or the presence of relevant information in the pre-training data. The chart provides strong evidence that fine-tuning is a valuable technique for improving the performance of language models on specific tasks and addressing identified weaknesses.