## Line Chart: Accuracy Comparison of LLaMA2 vs. LLaMA2-FT Across Mathematical Topics
### Overview
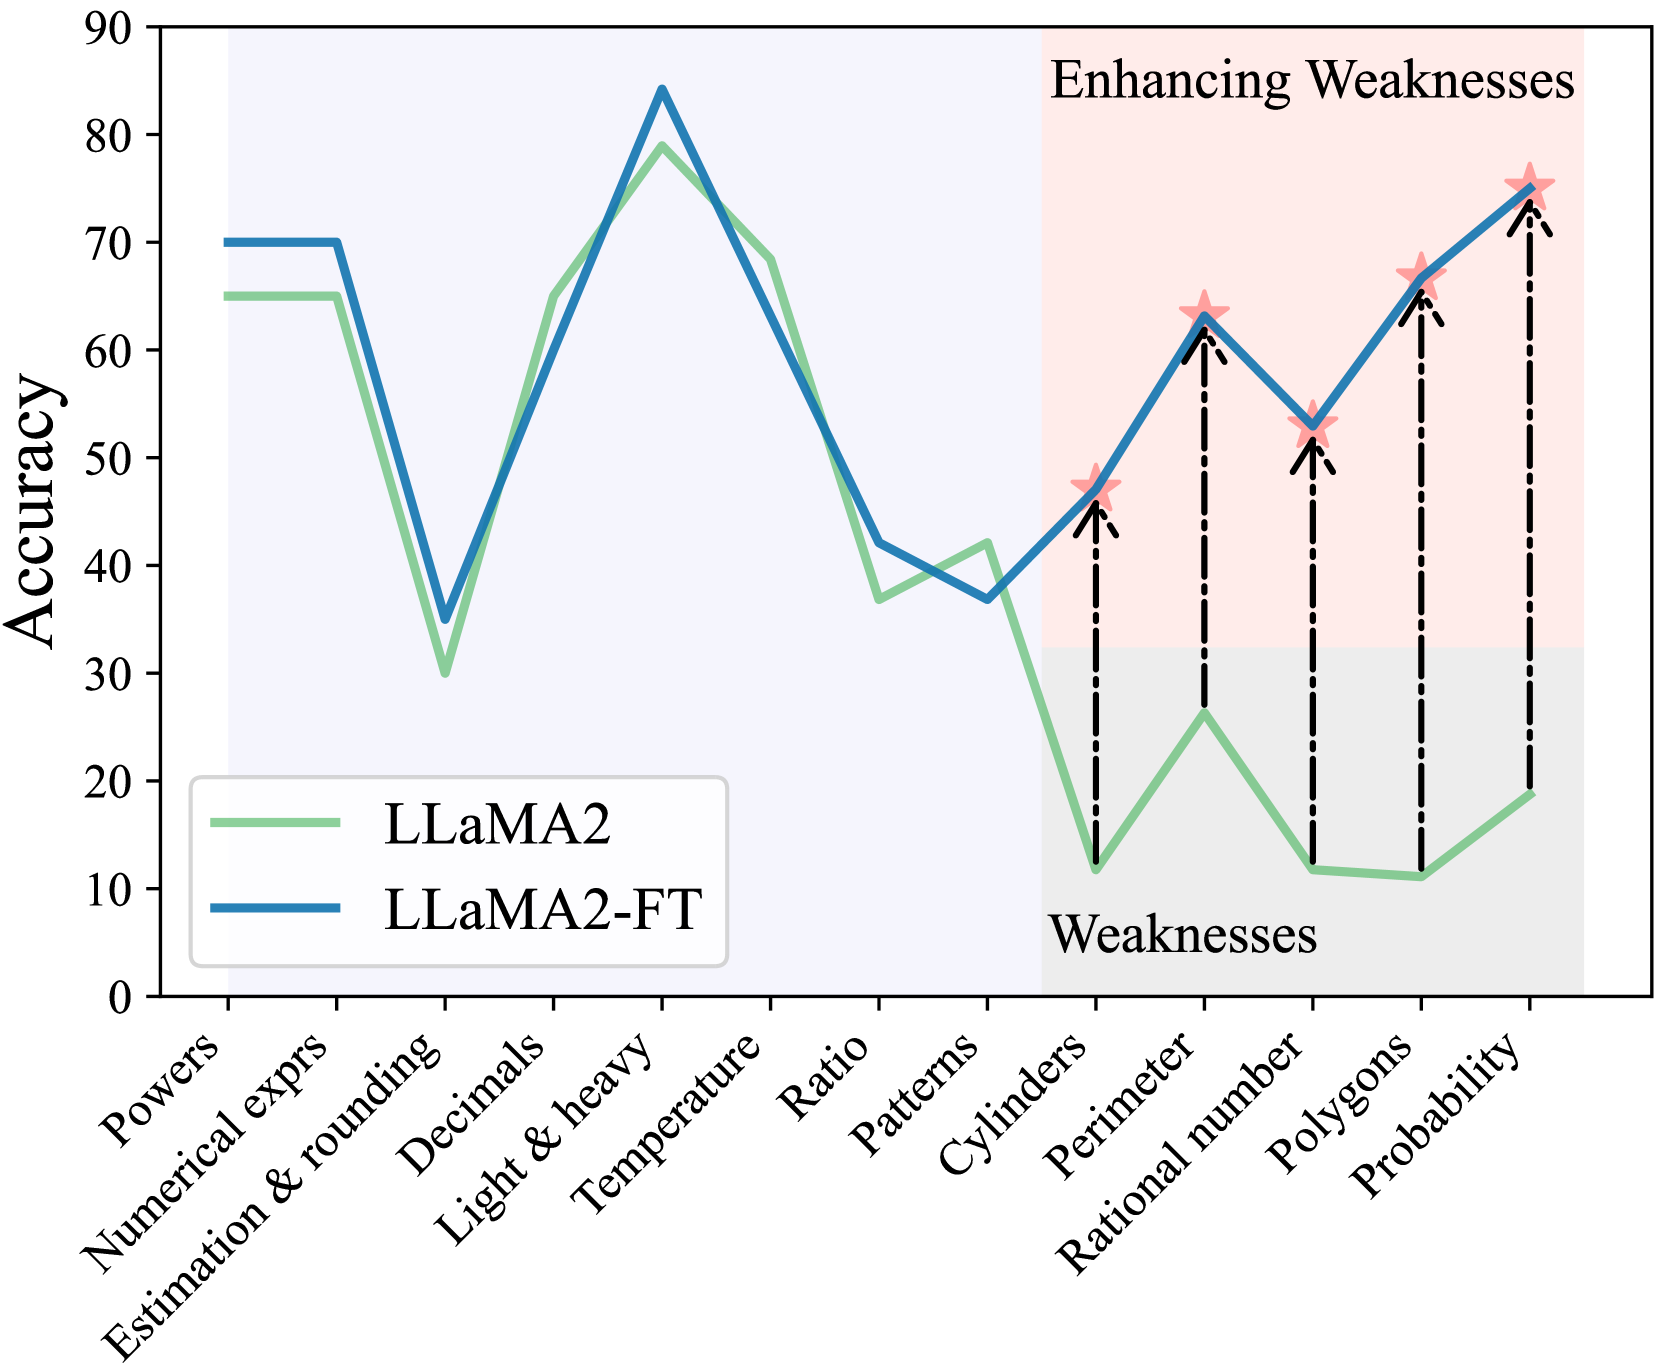
This image is a line chart comparing the accuracy percentages of two language models, "LLaMA2" and "LLaMA2-FT" (likely a fine-tuned version), across 13 distinct mathematical topics. The chart is divided into two background regions: a light blue region on the left and a light pink region on the right labeled "Enhancing Weaknesses." The rightmost section, containing the last five topics, is also labeled "Weaknesses" at the bottom. The chart demonstrates how the fine-tuned model (LLaMA2-FT) improves upon the base model's (LLaMA2) performance, particularly in areas identified as weaknesses.
### Components/Axes
* **Chart Type:** Line chart with two data series.
* **Y-Axis:** Labeled "Accuracy". Scale ranges from 0 to 90, with major tick marks every 10 units (0, 10, 20, ..., 90).
* **X-Axis:** Lists 13 categorical mathematical topics. The labels are rotated approximately 45 degrees for readability. From left to right:
1. Powers
2. Numerical exprs
3. Estimation & rounding
4. Decimals
5. Light & heavy
6. Temperature
7. Ratio
8. Patterns
9. Cylinders
10. Perimeter
11. Rational number
12. Polygons
13. Probability
* **Legend:** Located in the bottom-left corner of the plot area.
* A solid green line corresponds to "LLaMA2".
* A solid blue line corresponds to "LLaMA2-FT".
* **Annotations:**
* A light pink shaded rectangle covers the rightmost five topics (Cylinders to Probability), labeled "Enhancing Weaknesses" in the top-right corner.
* The word "Weaknesses" is printed at the bottom of this pink region, aligned with the "Cylinders" tick mark.
* For each of the five topics in the "Weaknesses" region, a black dashed arrow points upward from the green line (LLaMA2) to the blue line (LLaMA2-FT). At the tip of each arrow (on the blue line) is a small, pink, five-pointed star.
### Detailed Analysis
**Data Series Trends:**
* **LLaMA2 (Green Line):** Shows high variability. It starts relatively high (~65%), dips sharply at "Estimation & rounding" (~30%), peaks at "Light & heavy" (~79%), then generally declines, hitting very low points in the "Weaknesses" section (as low as ~11% for "Polygons").
* **LLaMA2-FT (Blue Line):** Follows a similar overall pattern to LLaMA2 but is consistently equal to or higher than the green line. The improvement is most dramatic in the "Weaknesses" section, where the blue line shows a strong upward trend while the green line remains low.
**Approximate Data Points (Topic: LLaMA2 %, LLaMA2-FT %):**
1. **Powers:** ~65%, ~70%
2. **Numerical exprs:** ~65%, ~70%
3. **Estimation & rounding:** ~30%, ~35%
4. **Decimals:** ~65%, ~60% *(Note: LLaMA2-FT is slightly lower here)*
5. **Light & heavy:** ~79%, ~84%
6. **Temperature:** ~68%, ~68% *(Approximately equal)*
7. **Ratio:** ~37%, ~42%
8. **Patterns:** ~42%, ~37% *(Note: LLaMA2-FT is slightly lower here)*
9. **Cylinders:** ~12%, ~47% *(Large improvement, marked with star)*
10. **Perimeter:** ~26%, ~63% *(Large improvement, marked with star)*
11. **Rational number:** ~12%, ~52% *(Large improvement, marked with star)*
12. **Polygons:** ~11%, ~66% *(Large improvement, marked with star)*
13. **Probability:** ~19%, ~75% *(Large improvement, marked with star)*
### Key Observations
1. **Targeted Improvement:** The most significant and consistent gains for LLaMA2-FT occur precisely in the five topics (Cylinders through Probability) highlighted as "Weaknesses" for the base model. The dashed arrows and stars explicitly draw attention to these improvements.
2. **Performance Gap:** In the "Weaknesses" section, the accuracy gap between the two models is substantial, often exceeding 40 percentage points (e.g., Polygons: ~11% vs. ~66%).
3. **General Competence:** In the first eight topics (outside the highlighted weaknesses), the two models perform comparably, with LLaMA2-FT holding a slight edge in most, but not all, cases (e.g., it is slightly worse on "Decimals" and "Patterns").
4. **Peak Performance:** Both models achieve their highest accuracy on the "Light & heavy" topic (~79% and ~84%).
5. **Lowest Performance:** The base LLaMA2 model's lowest accuracy is on "Polygons" (~11%). The fine-tuned model's lowest point is on "Patterns" (~37%), which is still significantly higher than the base model's low points.
### Interpretation
This chart visually argues for the effectiveness of a fine-tuning (FT) process applied to the LLaMA2 model. The core message is that fine-tuning can be strategically used to "enhance weaknesses"—it dramatically improves performance on specific, targeted tasks where the base model struggles, without causing significant degradation on tasks where the base model was already competent.
The design of the chart reinforces this narrative. The shaded "Enhancing Weaknesses" region and the annotation arrows create a clear before-and-after story for the five selected topics. The data suggests the fine-tuning was highly successful, transforming areas of near-failure (10-20% accuracy) into areas of moderate to strong competence (50-75% accuracy). This implies the fine-tuning data or method was particularly well-suited to addressing the specific reasoning challenges posed by topics like geometry (Cylinders, Perimeter, Polygons), number theory (Rational number), and Probability. The chart serves as evidence that model weaknesses are not fixed and can be addressed through targeted post-training.