## Line Graph: Accuracy Comparison of LLaMA2 and LLaMA2-FT Models
### Overview
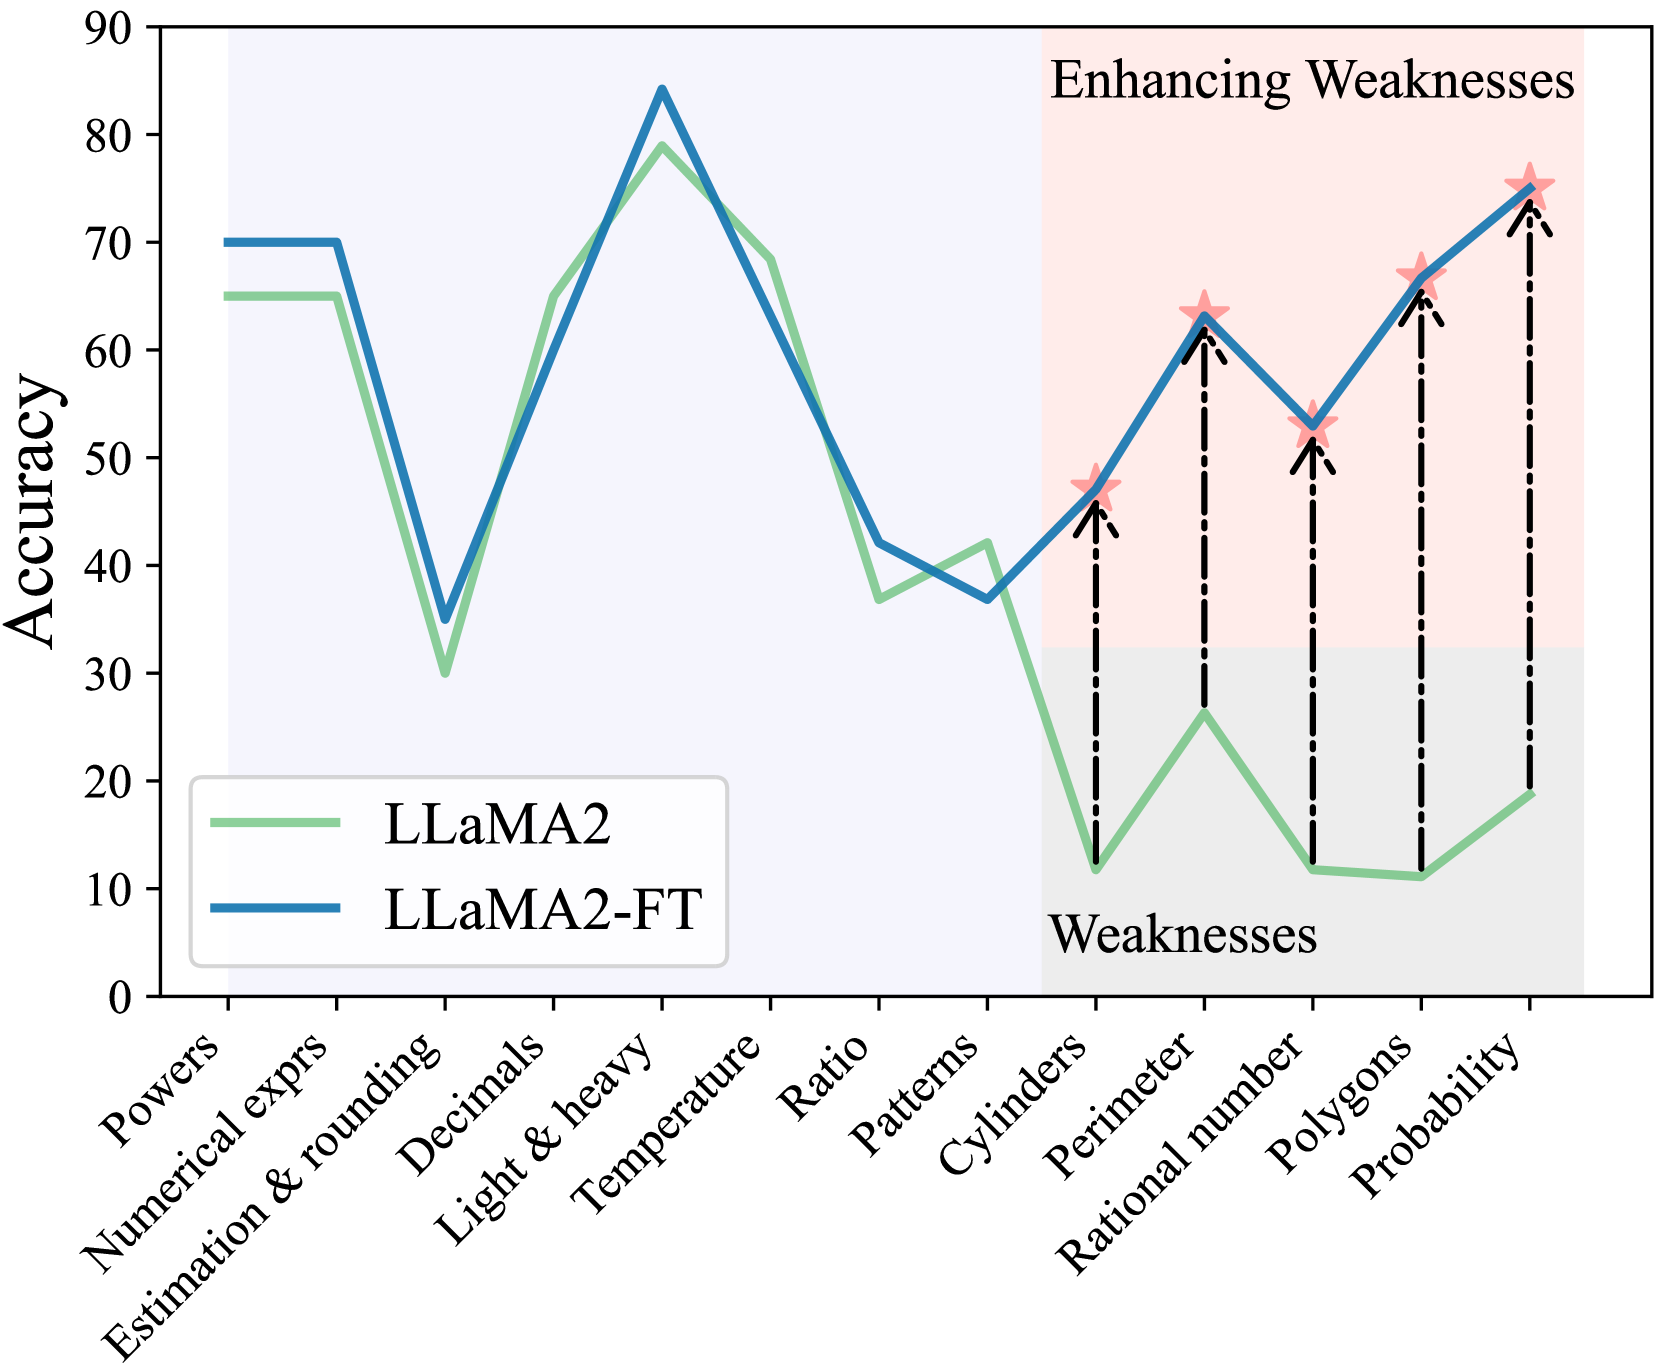
The image is a line graph comparing the accuracy of two models, **LLaMA2** (green line) and **LLaMA2-FT** (blue line), across 12 categories. The graph highlights performance trends, weaknesses, and enhancements in model capabilities. A shaded "Weaknesses" region (gray) and an "Enhancing Weaknesses" region (pink) are marked, with stars and arrows indicating specific data points.
---
### Components/Axes
- **X-Axis (Categories)**:
Powers, Numerical exprs, Estimation & rounding, Decimals, Light & heavy, Temperature, Ratio, Patterns, Cylinders, Perimeter, Rational number, Polygons, Probability.
- **Y-Axis (Accuracy)**:
Scale from 0 to 90, labeled "Accuracy."
- **Legend**:
- Green line: **LLaMA2**
- Blue line: **LLaMA2-FT**
- **Shaded Regions**:
- **Weaknesses**: Gray area spanning "Cylinders" to "Probability."
- **Enhancing Weaknesses**: Pink area spanning "Cylinders" to "Probability," with stars and arrows.
---
### Detailed Analysis
#### LLaMA2 (Green Line) Trends:
1. **High Accuracy in Early Categories**:
- Starts at ~65 accuracy in "Powers" and "Numerical exprs."
- Drops sharply to ~30 in "Estimation & rounding."
- Recovers to ~70 in "Decimals" and "Light & heavy."
- Declines to ~40 in "Temperature" and ~35 in "Ratio."
- Further drops to ~20 in "Patterns" and ~10 in "Cylinders."
- Minimal recovery to ~15 in "Perimeter" and ~10 in "Rational number."
- Slight improvement to ~15 in "Polygons" and ~20 in "Probability."
2. **Weaknesses Region**:
- Consistently low accuracy (10–20) in "Cylinders," "Perimeter," "Rational number," and "Polygons."
#### LLaMA2-FT (Blue Line) Trends:
1. **Improved Performance**:
- Starts at ~70 in "Powers" and "Numerical exprs."
- Drops to ~40 in "Estimation & rounding" but recovers to ~75 in "Decimals."
- Peaks at ~85 in "Light & heavy" and ~70 in "Temperature."
- Declines to ~45 in "Ratio" and ~35 in "Patterns."
- **Enhancing Weaknesses Region**:
- Sharp increase from ~10 in "Cylinders" to ~75 in "Probability."
- Stars and arrows highlight key improvements:
- ~50 in "Cylinders" (star).
- ~65 in "Perimeter" (star).
- ~75 in "Rational number" (star).
- ~75 in "Polygons" (star).
- ~85 in "Probability" (star).
2. **Weaknesses Region**:
- Moderate accuracy (35–75) in "Cylinders," "Perimeter," "Rational number," and "Polygons," with significant upward trends.
---
### Key Observations
1. **LLaMA2-FT Outperforms LLaMA2**:
- Higher accuracy in most categories (e.g., "Light & heavy," "Probability").
- LLaMA2-FT’s accuracy in "Probability" (~85) is 65% higher than LLaMA2 (~20).
2. **Enhancements in Weaknesses**:
- The "Enhancing Weaknesses" region shows targeted improvements, with LLaMA2-FT achieving near-peak accuracy in "Probability" and "Polygons."
3. **Persistent Weaknesses**:
- Both models struggle with "Cylinders" and "Rational number," though LLaMA2-FT shows marked improvement.
---
### Interpretation
The graph demonstrates that **LLaMA2-FT**, likely a fine-tuned version of LLaMA2, addresses weaknesses in the original model. The shaded "Enhancing Weaknesses" region highlights categories where LLaMA2-FT shows significant accuracy gains, particularly in "Probability" and "Polygons." The stars and arrows emphasize these improvements, suggesting intentional model adjustments to strengthen performance in previously weak areas.
The persistent low accuracy in "Cylinders" and "Rational number" for both models indicates unresolved challenges, possibly requiring further refinement. Overall, the data supports the hypothesis that fine-tuning enhances model robustness, especially in complex or specialized tasks.