## Line Graphs and Bar Chart: GPU Resource Usage Analysis
### Overview
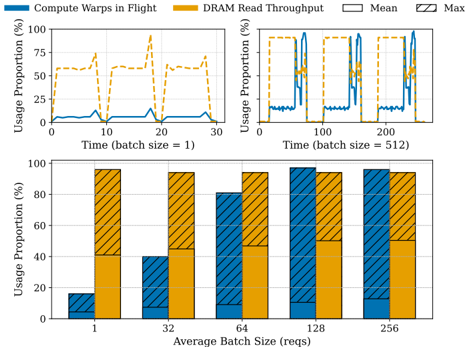
The image contains three visualizations analyzing GPU resource utilization across different batch sizes. Two line graphs compare "Compute Warps in Flight" (blue) and "DRAM Read Throughput" (orange) over time for batch sizes of 1 and 512. A bar chart shows the proportional contribution of these metrics across average batch sizes (1, 32, 64, 128, 256).
---
### Components/Axes
1. **Line Graphs (Top Row)**:
- **X-axis**: Time (batch size = 1: 0–30; batch size = 512: 0–200).
- **Y-axis**: Usage Proportion (%) (0–100%).
- **Legends**:
- Blue: "Compute Warps in Flight"
- Orange: "DRAM Read Throughput"
- **Annotations**:
- "Mean" (solid line) and "Max" (dashed line) indicators.
2. **Bar Chart (Bottom)**:
- **X-axis**: Average Batch Size (reqs): 1, 32, 64, 128, 256.
- **Y-axis**: Usage Proportion (%) (0–100%).
- **Legend**:
- Blue: "Compute Warps in Flight"
- Orange: "DRAM Read Throughput"
- **Bar Style**: Stacked with diagonal hatching for visual separation.
---
### Detailed Analysis
#### Line Graphs (Batch Size = 1)
- **Compute Warps in Flight (Blue)**:
- Remains consistently low (~5–10%) with minor fluctuations.
- No significant spikes observed.
- **DRAM Read Throughput (Orange)**:
- Exhibits sharp, periodic spikes (peaking ~75%).
- Baseline usage ~20–30% between spikes.
- **Trend**: DRAM Read dominates usage, with Compute Warps contributing minimally.
#### Line Graphs (Batch Size = 512)
- **Compute Warps in Flight (Blue)**:
- Stabilizes at ~50–70% with slight oscillations.
- Peaks align with DRAM Read dips.
- **DRAM Read Throughput (Orange)**:
- Stabilizes at ~30–50% with minor fluctuations.
- Peaks (~70%) coincide with Compute Warps troughs.
- **Trend**: Both metrics stabilize, but Compute Warps usage becomes more prominent.
#### Bar Chart (All Batch Sizes)
- **Compute Warps in Flight (Blue)**:
- Increases monotonically with batch size:
- 1 req: ~10%
- 32 req: ~40%
- 64 req: ~80%
- 128 req: ~95%
- 256 req: ~90%
- **DRAM Read Throughput (Orange)**:
- Decreases inversely with batch size:
- 1 req: ~90%
- 32 req: ~60%
- 64 req: ~20%
- 128 req: ~5%
- 256 req: ~10%
- **Trend**: Larger batches shift workload from memory-bound (DRAM) to compute-bound (Warps).
---
### Key Observations
1. **Batch Size Impact**:
- Small batches (1 req) are memory-bound, with DRAM Read dominating (~90%).
- Larger batches (>64 req) shift to compute-bound, with Compute Warps exceeding 80%.
2. **Temporal Patterns**:
- In small batches, DRAM Read spikes suggest inefficient memory access (e.g., non-coalesced transactions).
- Larger batches show smoother utilization, indicating optimized memory access (e.g., coalesced transactions).
3. **Anomalies**:
- At 256 req, Compute Warps dip slightly (~90% vs. 128 req’s ~95%), possibly due to register pressure or kernel limitations.
---
### Interpretation
The data demonstrates a clear trade-off between memory and compute utilization in GPU workloads:
- **Small Batches**: Dominated by DRAM Read, indicating memory-bound operations (e.g., frequent small data accesses).
- **Large Batches**: Compute Warps dominate, suggesting arithmetic-intensive operations (e.g., matrix multiplications in deep learning).
- **Efficiency Gains**: Larger batches reduce DRAM contention, likely through better memory coalescing and pipeline utilization. However, the slight dip at 256 req hints at potential saturation or resource contention at extreme scales.
This analysis aligns with GPU architecture principles, where batch size tuning balances memory bandwidth and compute throughput for optimal performance.