## Diagram: Claim Verification Process
### Overview
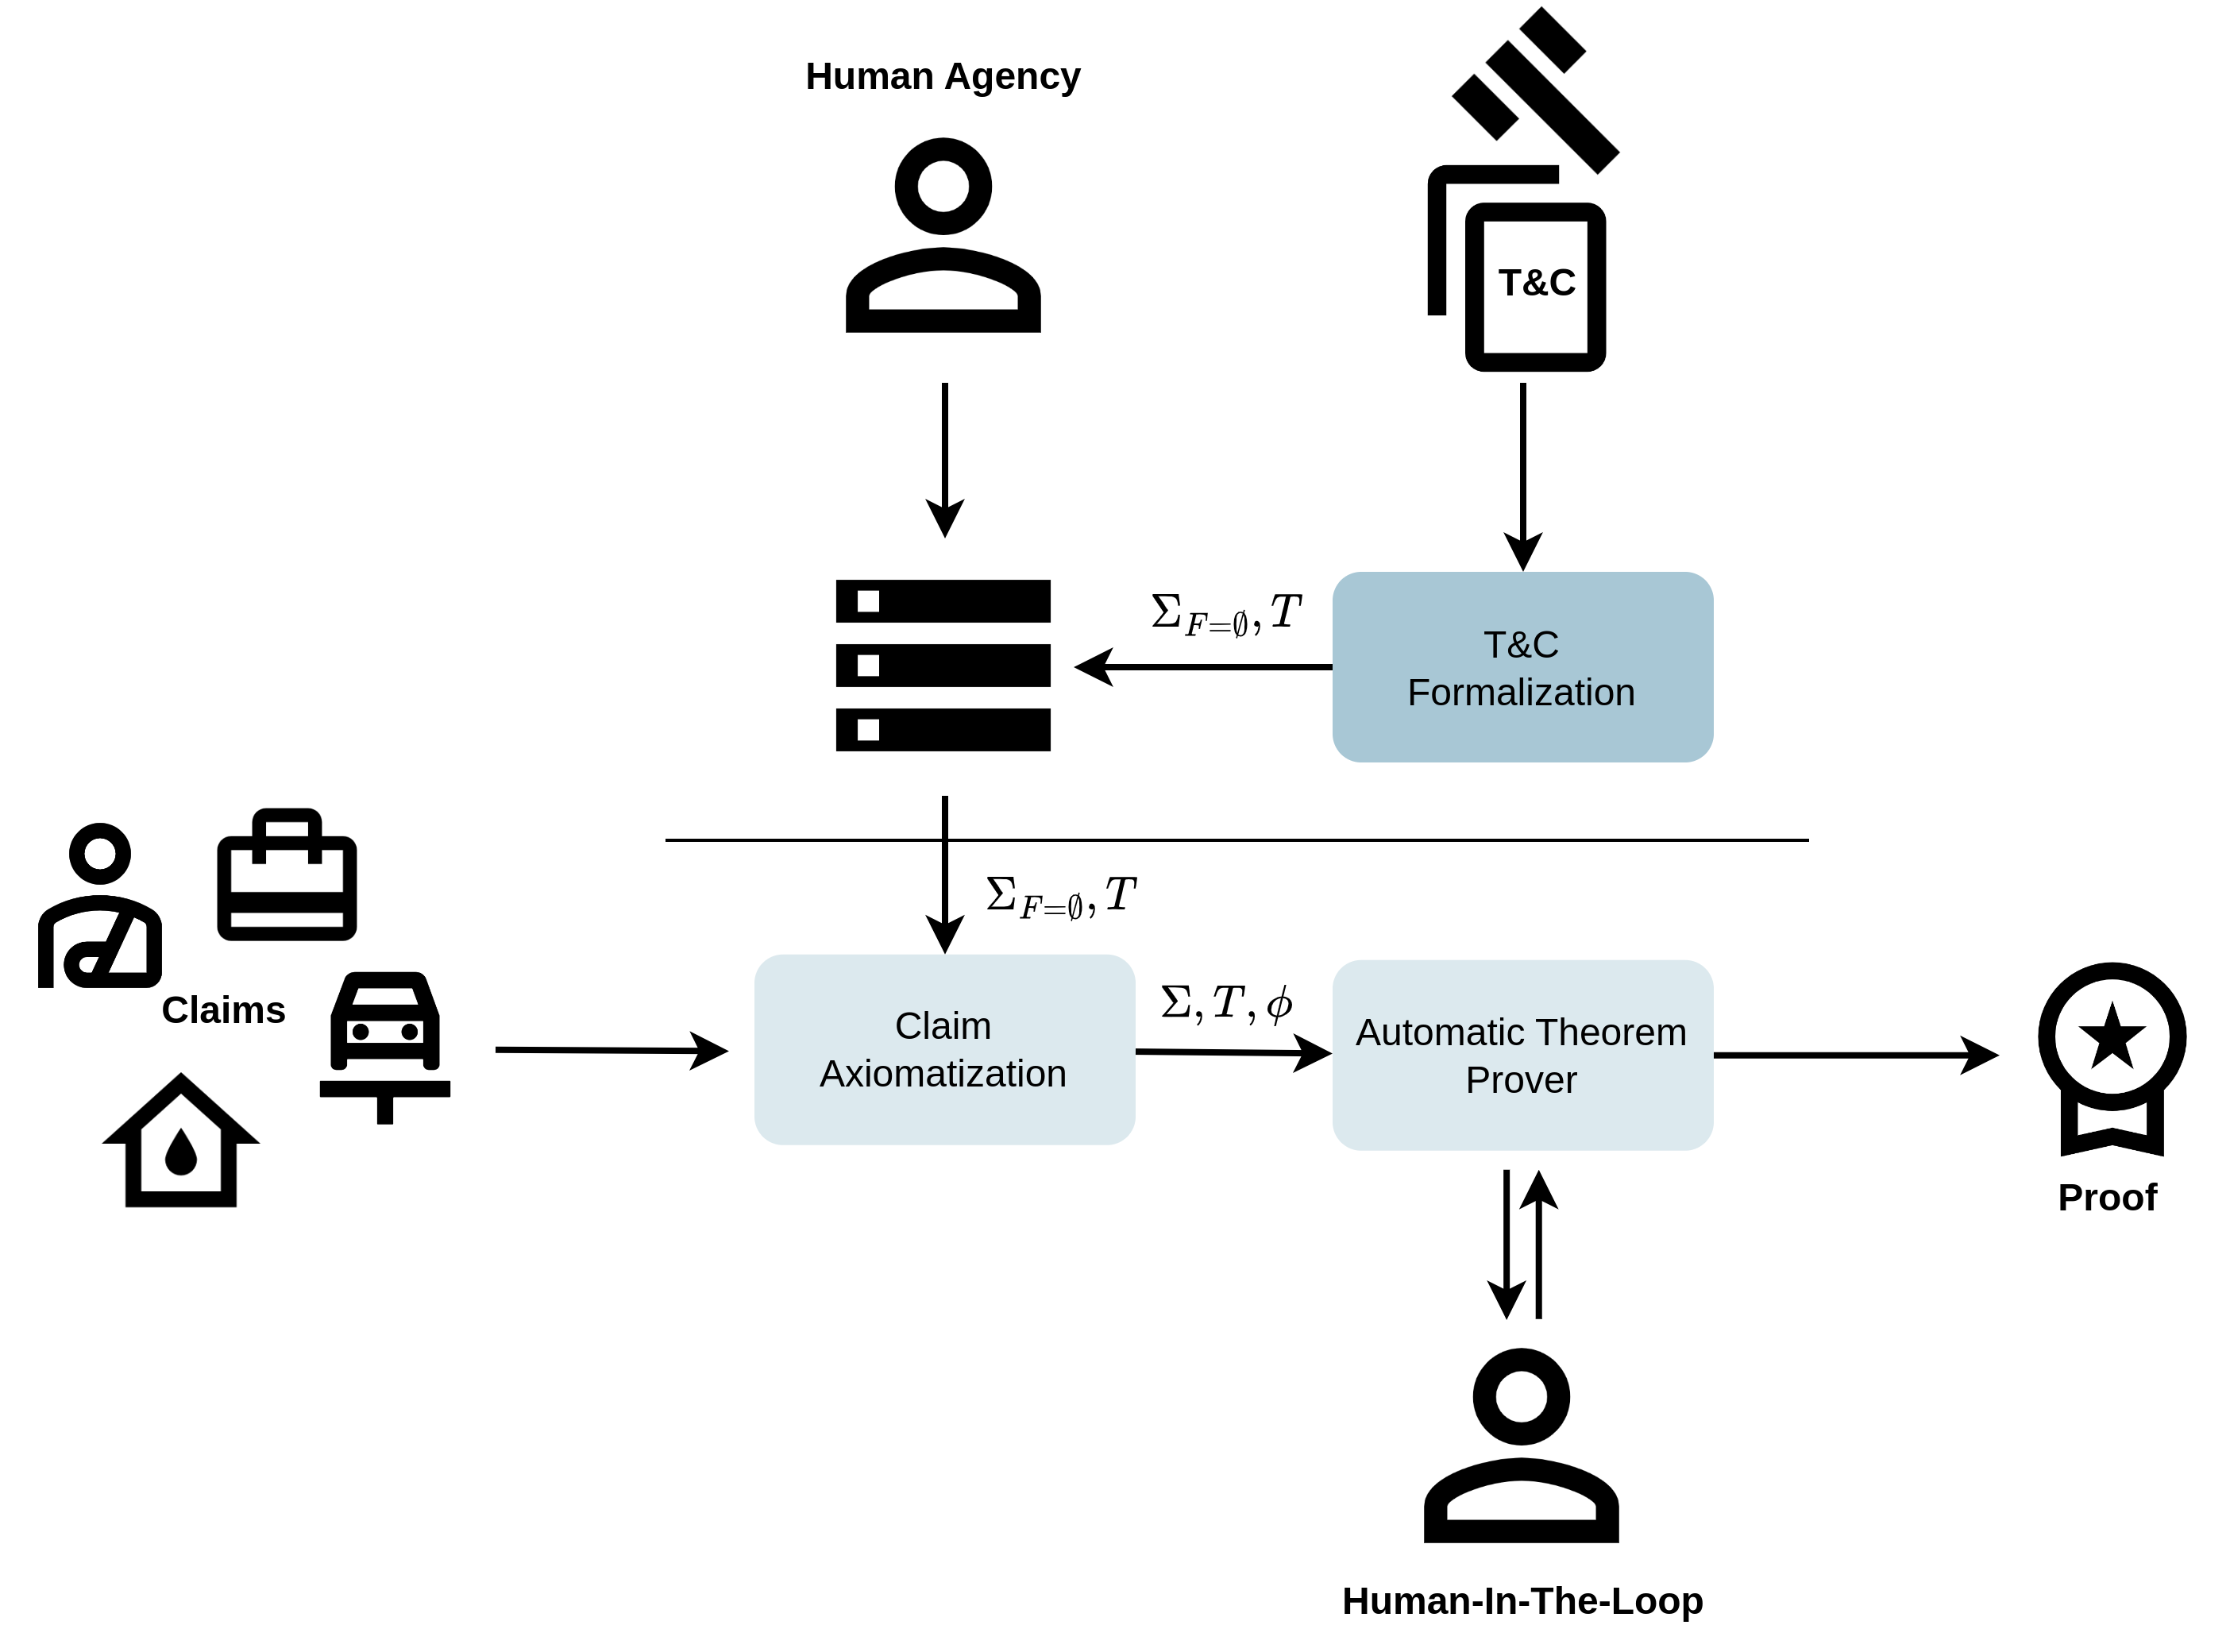
The image is a diagram illustrating a claim verification process, likely automated with human interaction. It outlines the steps from initial claim submission to proof generation, incorporating human agency, terms and conditions (T&C), and automated theorem proving.
### Components/Axes
* **Nodes:**
* Human Agency (top-center): Represents human input and oversight.
* T&C (top-right): Represents Terms and Conditions.
* Claims (bottom-left): Represents the initial claims data.
* Claim Axiomatization (center-left): Represents the process of converting claims into a formal system.
* Automatic Theorem Prover (center): Represents the automated reasoning engine.
* Human-In-The-Loop (bottom-center): Represents human interaction with the theorem prover.
* Proof (bottom-right): Represents the final verified proof.
* **Edges:** Arrows indicate the flow of information and processes.
* **Labels:**
* ΣF=0, T: Appears twice, indicating input to the data storage and to the Claim Axiomatization.
* Σ, T, φ: Indicates input to the Automatic Theorem Prover.
### Detailed Analysis
1. **Human Agency:** A human figure icon at the top-center is labeled "Human Agency." An arrow points downwards from this node to a data storage icon.
2. **T&C:** A stack of documents labeled "T&C" is at the top-right. An arrow points downwards from this node to a light-blue rounded rectangle labeled "T&C Formalization."
3. **Data Storage:** A data storage icon is located below the "Human Agency" node. An arrow points downwards from this node to the "Claim Axiomatization" node. The label "ΣF=0, T" is positioned to the right of the data storage icon, with an arrow pointing towards the data storage icon.
4. **T&C Formalization:** A light-blue rounded rectangle labeled "T&C Formalization" is located to the right of the data storage icon. An arrow points from the "T&C" node to this rectangle.
5. **Claims:** Icons representing a person, suitcase, house, and car are grouped together and labeled "Claims" at the bottom-left. An arrow points from this group to a light-blue rounded rectangle labeled "Claim Axiomatization."
6. **Claim Axiomatization:** A light-blue rounded rectangle labeled "Claim Axiomatization" is located in the center-left. An arrow points from the "Claims" group to this rectangle. The label "ΣF=0, T" is positioned above the arrow.
7. **Automatic Theorem Prover:** A light-blue rounded rectangle labeled "Automatic Theorem Prover" is located in the center. An arrow points from the "Claim Axiomatization" rectangle to this rectangle. The label "Σ, T, φ" is positioned above the arrow.
8. **Human-In-The-Loop:** A human figure icon labeled "Human-In-The-Loop" is located below the "Automatic Theorem Prover" rectangle. A double arrow points between this icon and the "Automatic Theorem Prover" rectangle, indicating bidirectional interaction.
9. **Proof:** A star icon labeled "Proof" is located at the bottom-right. An arrow points from the "Automatic Theorem Prover" rectangle to this icon.
### Key Observations
* The diagram illustrates a process where claims and T&C are formalized and fed into an automatic theorem prover.
* Human agency is involved both at the initial stage and in a loop with the theorem prover.
* The labels ΣF=0, T and Σ, T, φ likely represent different sets of axioms, theories, and formulas used in the process.
### Interpretation
The diagram depicts an automated claim verification system that leverages formal methods and human interaction. The process begins with the submission of claims and the formalization of relevant terms and conditions. These inputs are then used to create a formal system of axioms, which are fed into an automatic theorem prover. The theorem prover attempts to derive a proof of the claim's validity. Human-in-the-loop interaction allows for adjustments and refinements to the process, potentially improving the accuracy and efficiency of the verification. The final output is a verified proof, indicating that the claim has been successfully validated.