## Process Diagram: Falsification Experiment Workflow
### Overview
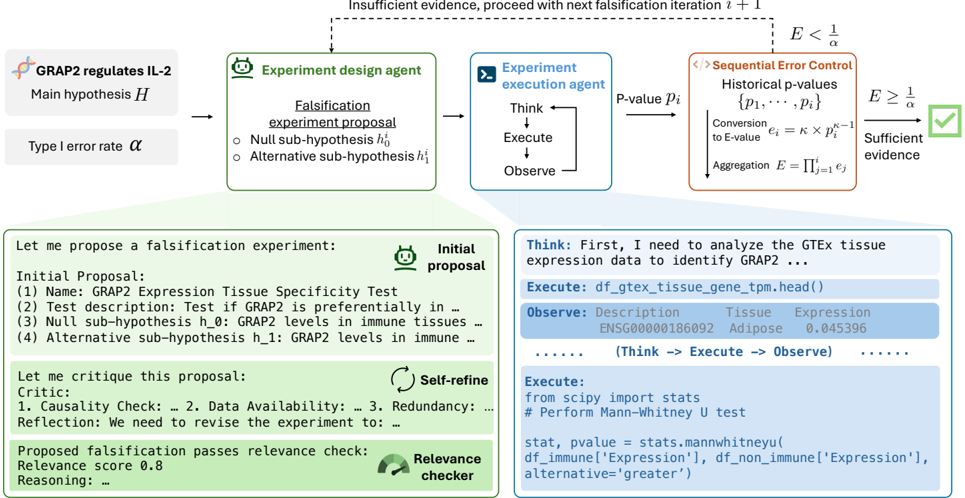
The image depicts a process diagram outlining a falsification experiment workflow. It involves several agents and steps, including experiment design, execution, sequential error control, and proposal refinement. The workflow starts with a main hypothesis and proceeds through iterative falsification attempts until sufficient evidence is gathered.
### Components/Axes
* **GRAP2 regulates IL-2**: Main hypothesis H
* **Type I error rate**: α
* **Experiment design agent**: Responsible for creating falsification experiment proposals.
* Falsification experiment proposal
* Null sub-hypothesis h₀
* Alternative sub-hypothesis h₁
* **Experiment execution agent**: Executes the experiment and observes the results.
* Think -> Execute -> Observe (loop)
* P-value pᵢ
* **Sequential Error Control**: Assesses the accumulated evidence.
* Historical p-values {p₁, ..., pᵢ}
* Conversion to E-value: eᵢ = κ × pᵢ^(κ-1)
* Aggregation: E = Πᵢ=1 eᵢ
* **Initial proposal**: A block of text representing the initial falsification experiment proposal.
* (1) Name: GRAP2 Expression Tissue Specificity Test
* (2) Test description: Test if GRAP2 is preferentially in ...
* (3) Null sub-hypothesis h_0: GRAP2 levels in immune tissues ...
* (4) Alternative sub-hypothesis h_1: GRAP2 levels in immune ...
* **Self-refine**: A process of critiquing and refining the experiment proposal.
* Critic:
1. Causality Check: ...
2. Data Availability: ...
3. Redundancy: ...
* Reflection: We need to revise the experiment to: ...
* **Relevance checker**: Assesses the relevance of the proposed falsification.
* Proposed falsification passes relevance check:
* Relevance score 0.8
* Reasoning: ...
* **Code Snippets**:
* `df_gtex_tissue_gene_tpm.head()`
* `from scipy import stats`
* `# Perform Mann-Whitney U test`
* `stat, pvalue = stats.mannwhitneyu(df_immune['Expression'], df_non_immune['Expression'], alternative='greater')`
* **Data Table**:
* Columns: Description, Tissue, Expression
* Row 1: ENSG00000186092, Adipose, 0.045396
* **Decision Points**:
* Insufficient evidence, proceed with next falsification iteration i + 1 (E < 1/α)
* Sufficient evidence (E ≥ 1/α)
### Detailed Analysis or ### Content Details
The workflow begins with the main hypothesis "GRAP2 regulates IL-2". An experiment design agent creates a falsification experiment proposal, including null and alternative sub-hypotheses. This proposal is then passed to an experiment execution agent, which performs the experiment and observes the results, generating a p-value (pᵢ).
The p-value is fed into a sequential error control module. This module converts the p-value to an E-value (eᵢ) using the formula eᵢ = κ × pᵢ^(κ-1) and aggregates the E-values (E = Πᵢ=1 eᵢ).
If the aggregated E-value (E) is less than 1/α, where α is the Type I error rate, the process loops back to the experiment design agent for another falsification iteration. If E is greater than or equal to 1/α, sufficient evidence is considered to have been gathered.
The initial proposal is subject to critique and self-refinement. A relevance checker assesses the proposal, assigning a relevance score (0.8 in this case).
The "Think" block contains the statement "First, I need to analyze the GTEx tissue expression data to identify GRAP2 ...". The "Execute" block shows the code `df_gtex_tissue_gene_tpm.head()`, which suggests the use of a dataframe named `df_gtex_tissue_gene_tpm`. The "Observe" block shows a sample row from this dataframe, indicating the expression level of gene ENSG00000186092 in Adipose tissue is 0.045396.
### Key Observations
* The workflow is iterative, involving repeated falsification attempts.
* Sequential error control is used to manage the accumulation of evidence.
* The process includes mechanisms for proposal critique and refinement.
* GTEx tissue expression data is used to identify GRAP2.
* Mann-Whitney U test is used to compare expression levels in immune and non-immune tissues.
### Interpretation
The diagram illustrates a rigorous approach to hypothesis testing using falsification. The iterative nature of the workflow allows for continuous refinement of the experiment design based on the evidence gathered. The use of sequential error control helps to manage the risk of false positives as evidence accumulates. The integration of GTEx data and statistical tests like the Mann-Whitney U test demonstrates the use of computational tools in the falsification process. The relevance checker ensures that the proposed experiments are meaningful and contribute to the overall goal of falsifying the hypothesis.